Figure 4.
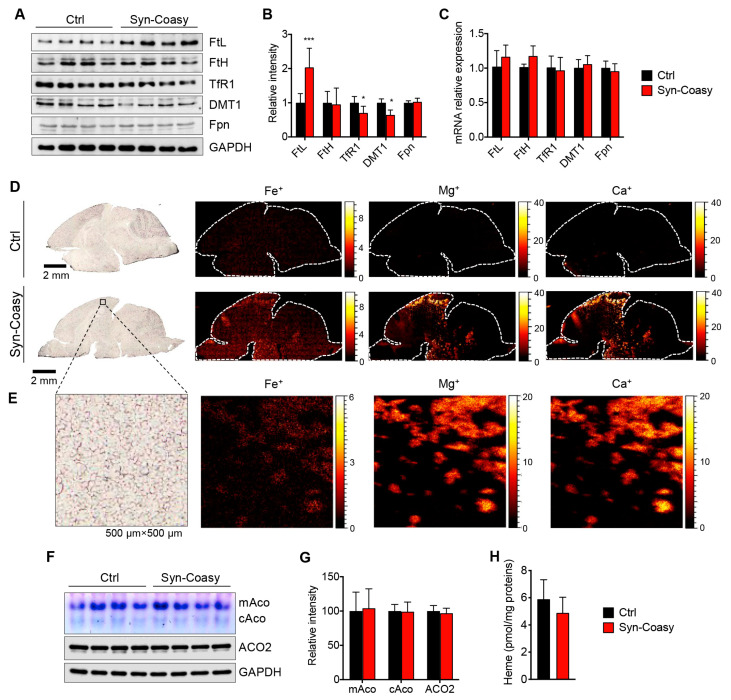
Iron content and homeostasis analysis. (A) Immunoblot and (B) densitometric quantification of proteins involved in homeostasis in forebrain homogenates from Ctrl (n ≥ 8) and Syn-Coasy (n ≥ 8) mice (age P12–P14). GAPDH was used as the loading control. * p < 0.05; *** p < 0.001 (one-way ANOVA). (C) Relative expression of the genes encoding the proteins analyzed in (A), in the Ctrl (n = 5) and Syn-Coasy (n = 5) mice forebrain. No statistically significant differences were observed (one-way ANOVA). (D) Elevation of Fe, Ca, and Mg in Syn-Coasy compared to Ctrl by TOF-SIMS imaging. (E) The high-resolution imaging of the cortex (500 µm × 500 µm) of the Syn-Coasy brain clearly showed colocalization of the Fe+, Ca+, and Mg+. (F) Representative in-gel activity of mitochondrial (mAco) and cytosolic (cAco) aconitase, and immunoblot of mitochondrial aconitase (ACO2) in forebrain homogenates from Ctrl (n = 8) and Syn-Coasy (n = 8) mice. (G) Densitometric quantification of (F). GAPDH was used as the loading control. (H) Heme quantification by absorbance at 400 nm of the soluble forebrain lysates. For all charts, mean ± SD is shown.

