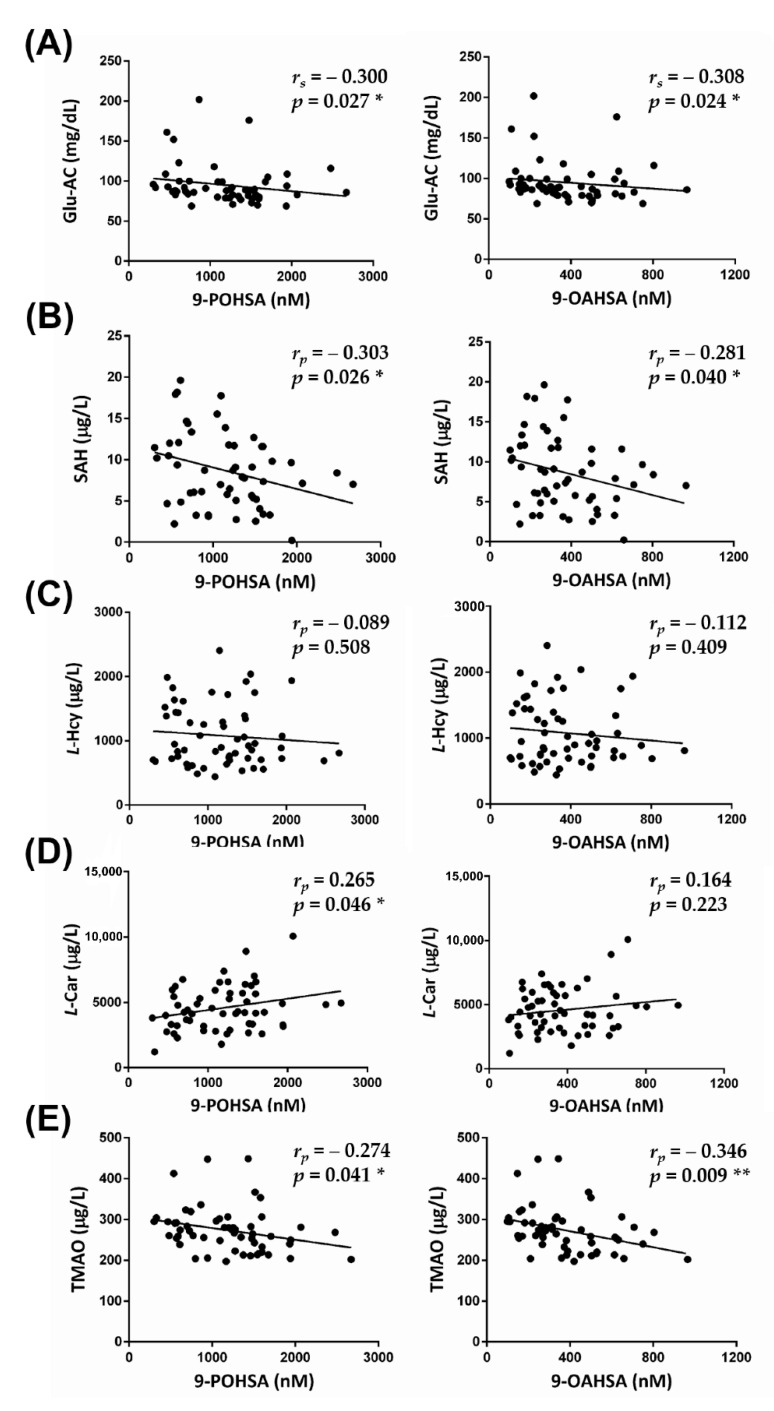
Figure 4.
The correlation of FAHFAs with non-traditional CV-related biomarkers. 9-POHSA and 9-OAHSA had a significant negative correlation with Glu-AC (A) and SAH (B), but not with l-Hcy (C). l-Car was also positively correlated with 9-POHSA (D). TMAO had a significant negative correlation with both 9-POHSA and 9-OAHSA (E). rs: Spearman correlation coefficient, rp: Pearson correlation coefficient. Data are presented as mean ± SD (* p < 0.05, ** p < 0.01).

