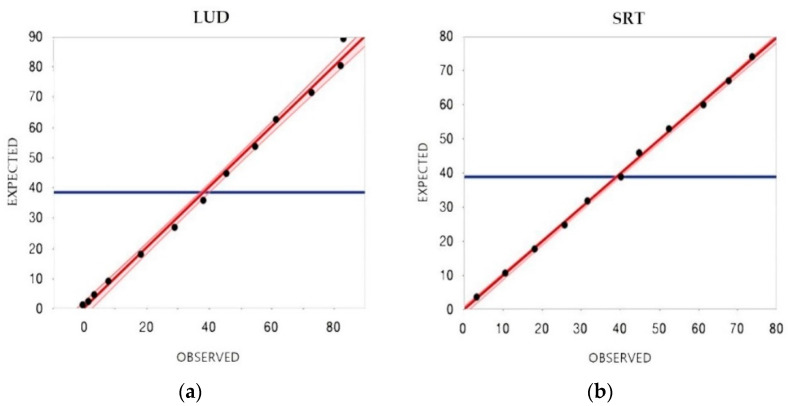
Figure 1.
Comparison between observed and expected results: (a) Linearity under dilution (LUD) of PTH concentration in a pool of sera serially diluted with distilled water. (b) Spike-recovery test (SRT) of PTH concentration in a pool of sera with low PTH concentration spiked with increasing amounts of a serum pool with high PTH concentration. The solid line indicates the linear association between expected and observed results. The blue line indicates the expected mean.

