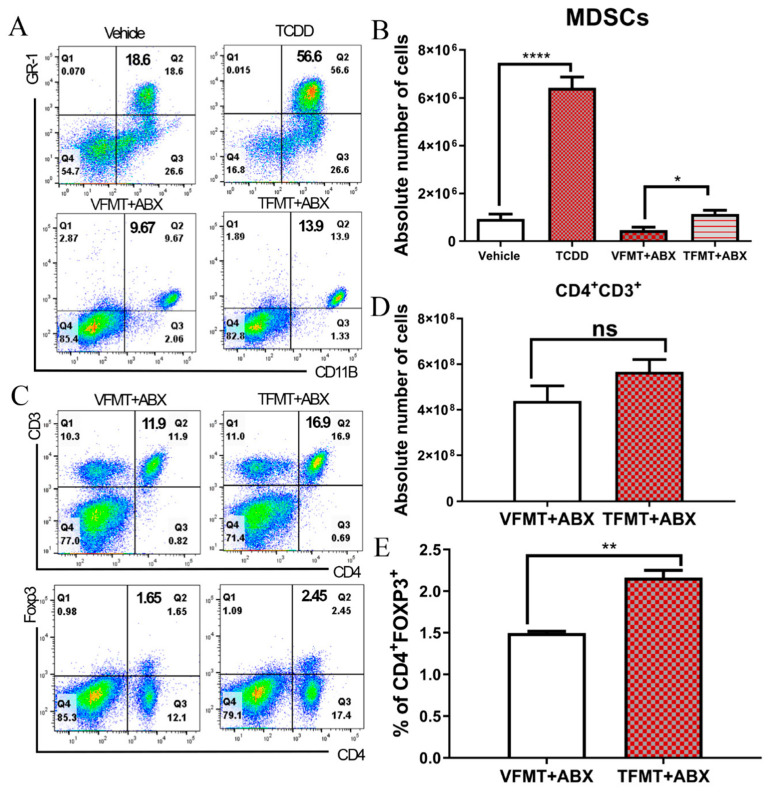
Figure 2.
Effect of fecal microbiota transplantation (FMT) on myeloid derived-suppressor cells MDSCs and regulatory T-cells (Tregs). (A,B) Naïve C57BL6 mice received either the vehicle (n = 6) or TCDD (n = 6) and were analyzed for MDSCs (CD11b and Gr1) in the peritoneal cavity. Antibiotic-treated (ABX) mice (n = 6 per experimental group) received feces from vehicle-treated (FMT from vehicle mice (VFMT)+ABX) or TCDD-treated mice (FMT from TCDD mice (TFMT)+ABX), and peritoneal cavity cells were stained for MDSCs. (A) Representative flow plots showing the percentages of MDSCs. (B) Absolute number of MDSCs from the peritoneal cavity of experimental mice. (C–E) Cells from spleens of VFMT (n = 6) or TFMT (n = 6) recipient mice were processed to stain for T-cell markers. (C) Representative flow plot of T cells (CD4+ and CD3+; top panel) and Tregs (CD4+ and FoxP3+; bottom panel) in spleen cells of ABX recipient mice following FMT from vehicle (VFMT) or TCDD (TFMT) donors. (D) Total T cell number (CD4+and CD3+) in spleen cells of ABX recipient mice following FMT from vehicle (VFMT) or TCDD (TFMT) donors. (E) Percentage of Tregs from spleen cells of ABX recipient mice following FMT from vehicle (VFMT) or TCDD (TFMT) donors. Vertical bars represent mean ± SEM. One-way analysis of variance (ANOVA) with Tukey’s multiple comparisons test was used to determine significance for MDSC comparison with more than two groups; * p < 0.05; ** p < 0.01. For T-cells and Tregs with only two groups, significance was determined using Student’s t test; * p < 0.05; ** p < 0.01; **** p < 0.0001. Data are representative of at least two independent experiments.

