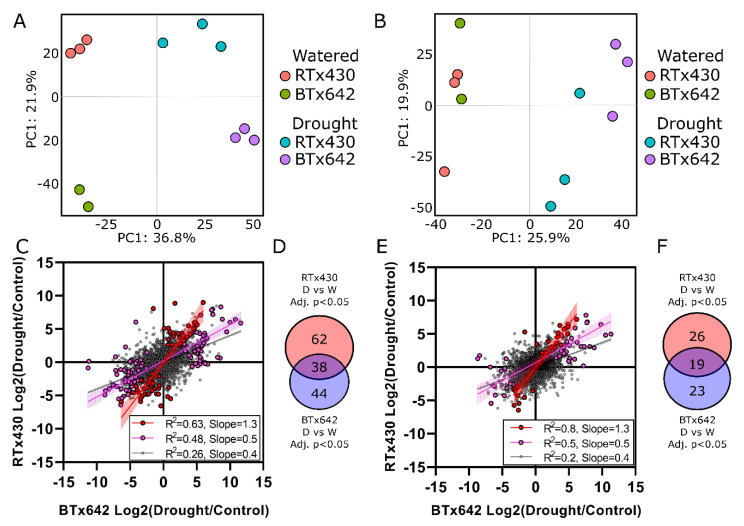
Figure 2.
Principal component analysis of organelle- (A) and cytosolic-enriched protein profiles (B) in response to drought. Correlation between RTx430 and BTx642 drought responses in (C) organelle- and (E) cytoplasm-enriched samples. Venn diagram summary of proteins with adj. p-value < 0.05 in each genotype for (D) organelle- and (F) cytosolic-enriched samples. Purple data points are significantly changed in either genotype, while red points correspond to RTx430-specific changes (adj. p-value < 0.05). D, Drought; W, Watered; PC, Principal Component.

