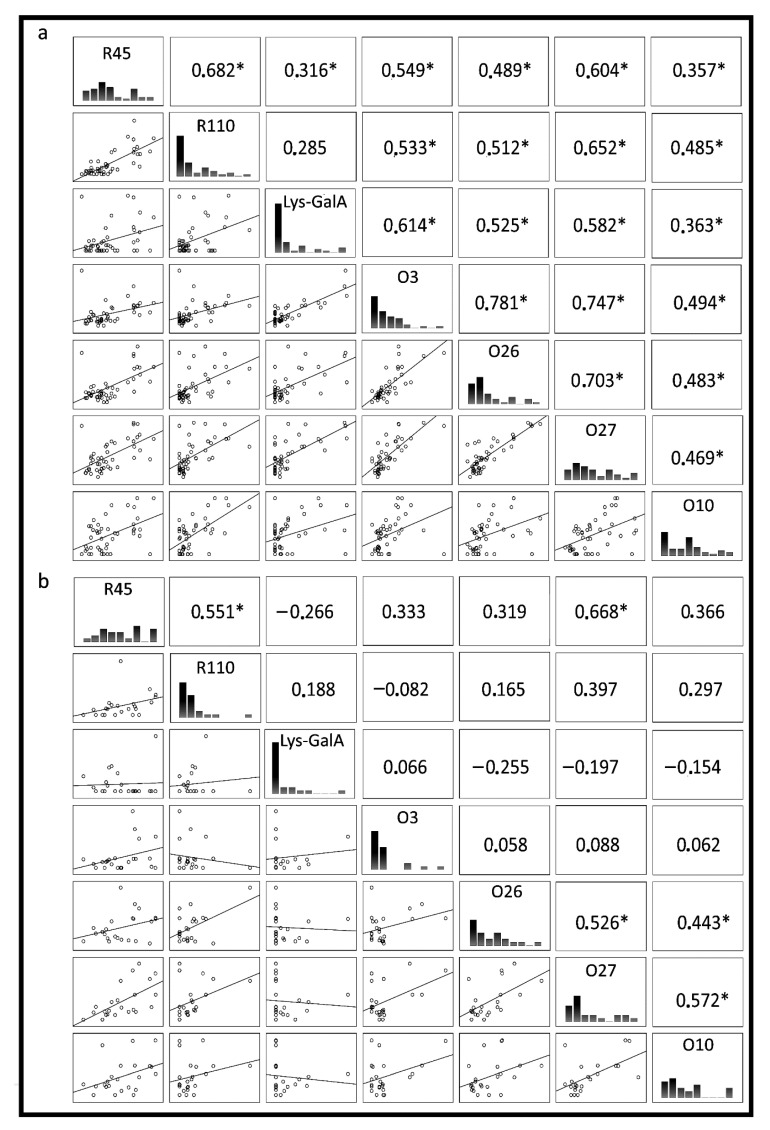
Figure 3.
Spearman correlation between: (a) rheumatic disease patients‘ sera, (b) healthy blood donors’ sera, reacting with P. mirabilis antigens: smooth LPSs: O3, O26, O27, O10; mutant LPS O3s: R110 and R45 and synthetic oligosaccharide fragment Lys-GalA. The linear relationship was determined by Spearman’s correlation coefficient (bottom left corner), histogram of serum reactivity (middle) and Spearman rank correlation of 1 or −1 (upper right corner). * Indicates a significant correlation.

