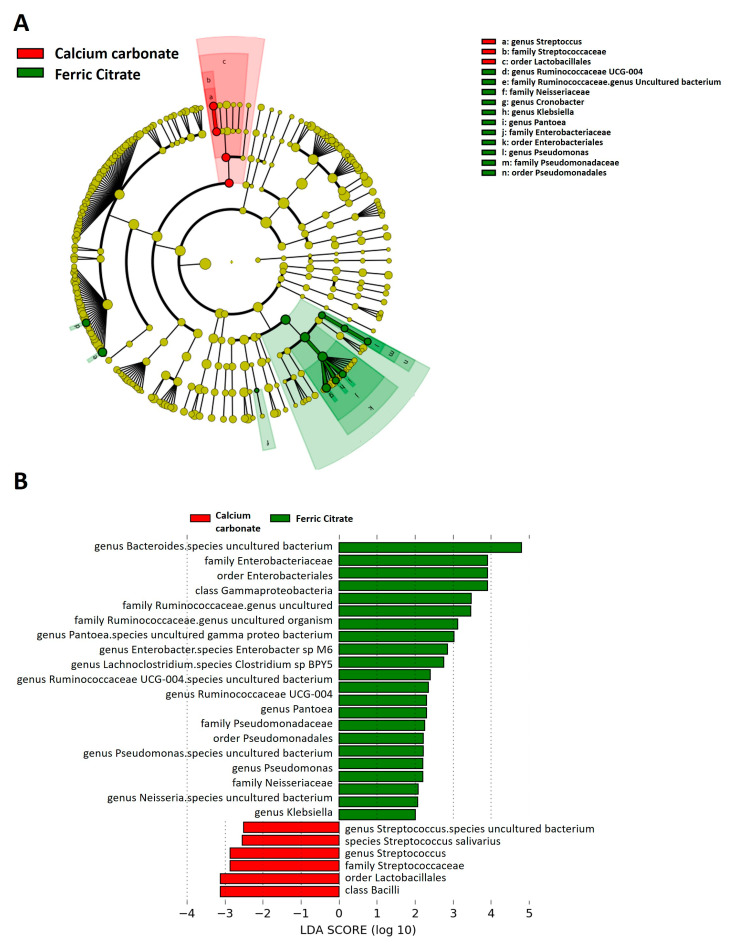
Figure 2.
Linear discriminant analysis Effect Size (LEfSe) showing microbiome differences between ferric citrate and calcium carbonate phosphate binder users at various taxonomic levels. (A) Cladogram demonstrating microbiome differences at various phylogenic levels, (B) LEfSe analysis with linear discriminant analysis (LDA) score representing statistical and biological differences in taxa between groups. Green indicates taxa enriched in a ferric citrate group and red indicates taxa enriched in a calcium carbonate phosphate binder group.

