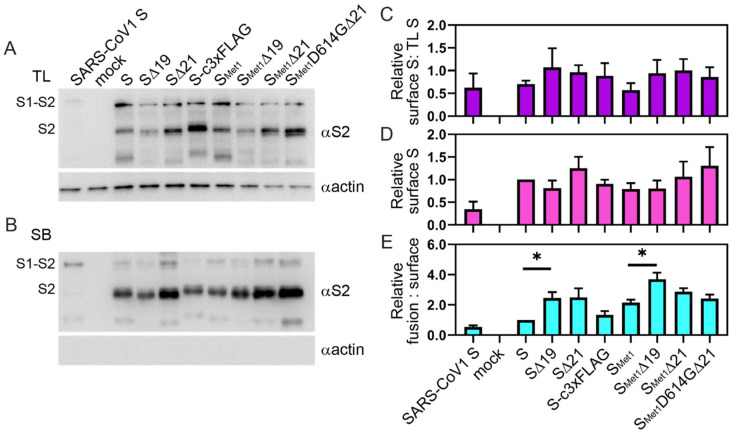
Figure 2.
Surface levels of S variants. BHK cells were transfected with plasmids encoding the indicated viral protein or negative control. After 36 h, cells were subjected to surface biotinylation. Precipitated proteins were separated via SDS-PAGE. Immunoblot assays were performed to detect levels of S2 expression in total cell lysates (A) and biotinylated surface material (B) with an anti-S2 antibody. Immunoblots were also probed for actin as a loading control. The immunoblot shown is representative of four independent trials. Immunoblots were quantified the ratio of surface S2 was compared to the level of S2 present in the total lysates (C), and the level of variant S on the surface was compared to the level of full-length S (D). The level of surface-produced S was also compared to the relative fusion activity shown in Figure 1 to determine the relative fusion activity to S protein level (E). Data shown are the averages and SEM. *, p < 0.05.

