Figure 3.
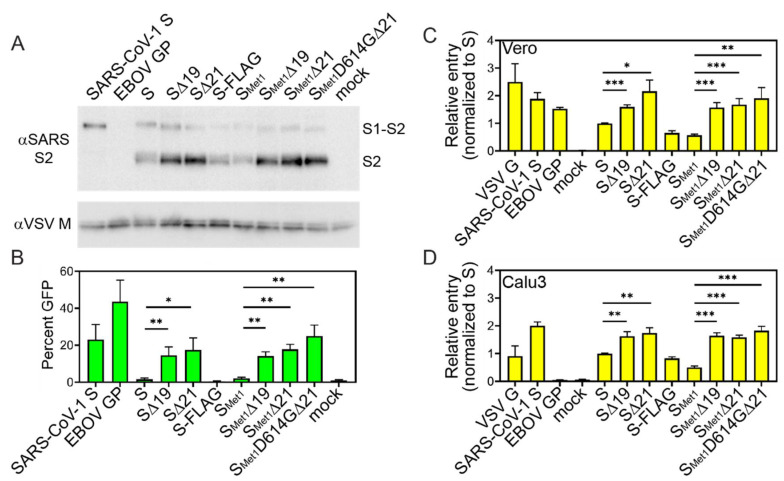
S variants incorporation in ppVSV and transduction efficiency. ppVSV particles were produced with the indicated viral glycoprotein. Particles were concentrated and analyzed for glycoprotein incorporation by separating proteins by SDS-PAGE followed by immunoblot analysis for both VSV M and the S2 subunit of SARS-CoV-2 (A). Particles were produced and analyzed three independent times; representative immunoblots are shown. (B) Equal volumes of ppVSV-GFP coated in the indicated viral glycoprotein were added to Vero cells. GFP positive cells were enumerated 16 h post-transduction with a flow cytometer. Data represent the percentage of Vero cells that produced the GFP reporter (B). Equal volumes of ppVSV-ffLuc coated in the indicated viral glycoprotein were added to Vero cells (C) or Calu3 cells (D) and luciferase levels were quantified 16 h following infection. Data represent the luciferase signal relative to full-length SARS-CoV-2 S levels. All transduction experiments were assessed in three independent experiments. Data shown are the averages and SEM. *, p < 0.05; **, p < 0.01; ***, p < 0.001.

