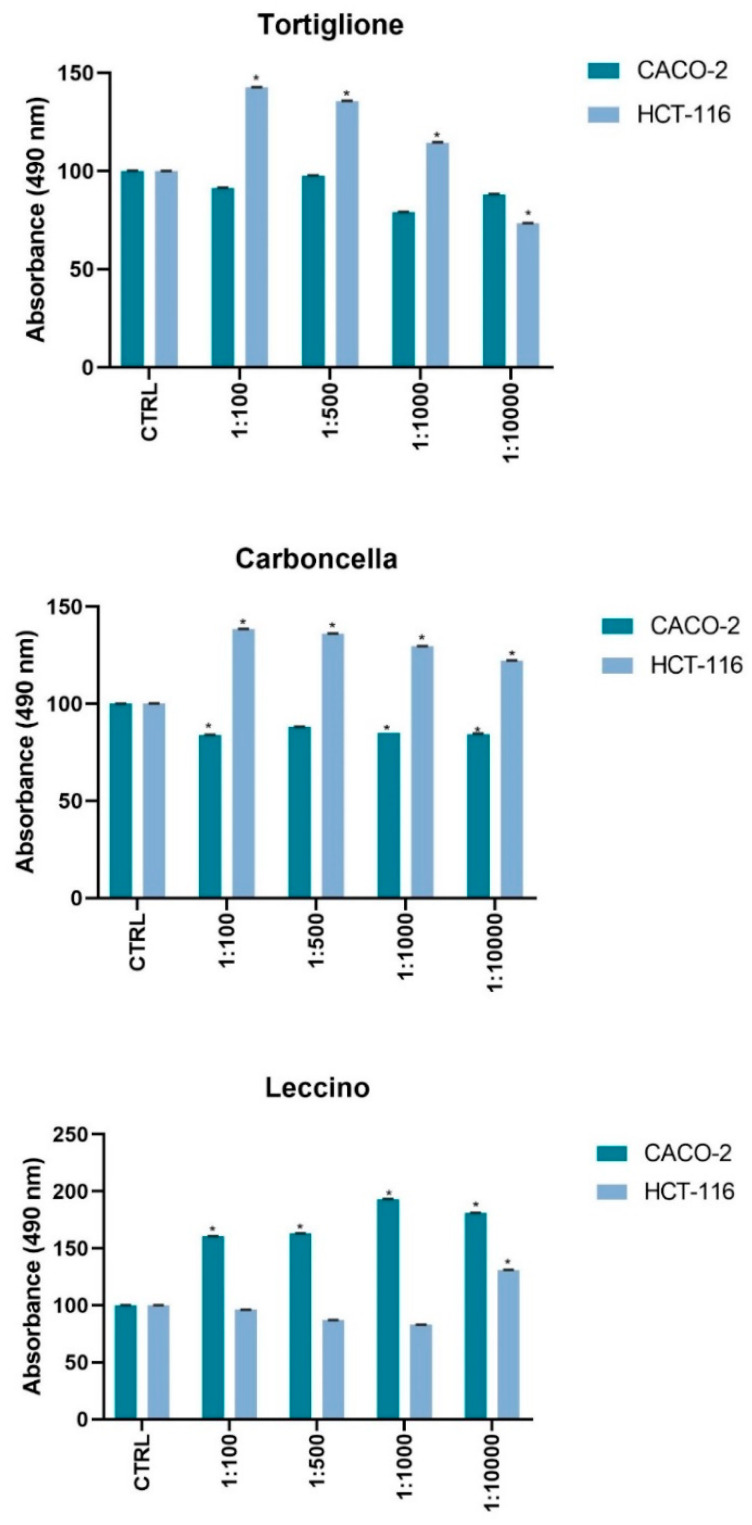
Figure 5.
Cell viability and metabolic activity was tested using a colorimetric assay MTS Caco-2 and HCT116 (1.0 × 10⁴ cells/well) were exposed to an increasing dilution (from 1:100; 1:500; 1:1000; 1:10,000) of dried extracts from 1mL Olea europaea L. cvs. Leccino, Carboncella and Tortiglione olives at 72 h of times. For each experiment n = 5 replicates wells were assayed per clone. Cell viability values were calculated as means and compared to untreated proliferant cells (CTRL). * p < 0.001 vs. untreated cells.

