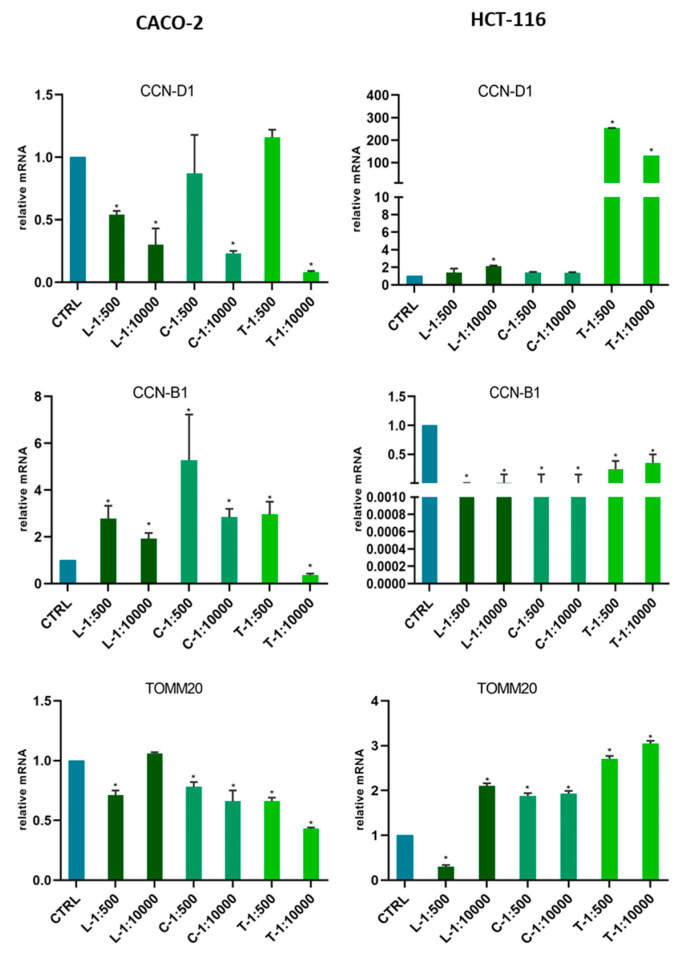
Figure 6.
Gene expression modulation under Extract treatments in colon cancer cells Caco-2 and HCT116. Gene expression was analyzed by Real Time-qPCR. The histograms represented normalized data with GUSB gene, and the results showed the average of three independent experiments. CCN-D1 (Cyclin D1); CCN-B1 (Cyclin B1); TOMM20 (Translocase of outer mitochondrial membrane 20). * p < 0.05 vs. untreated cells.

