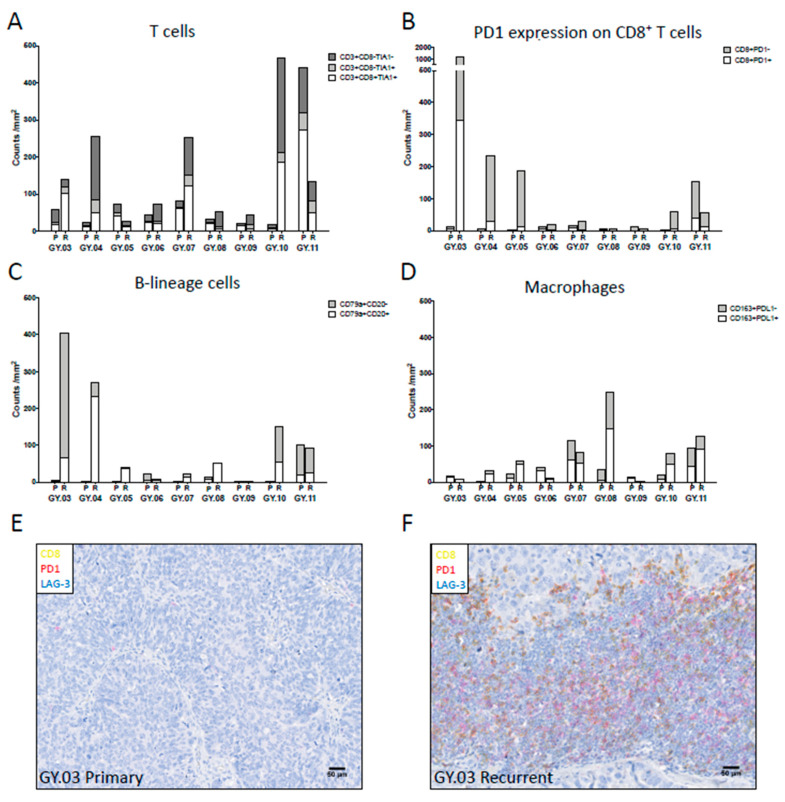
Figure 1.
The Immune infiltration in the tumor microenvironment (TME) of the primary (P) and recurrent (R) ovarian tumor samples was analyzed using multicolor IHC analysis. (A) T cell panel illustrating cytotoxic CD8+ T cells (CD3+CD8+TIA1+) in white, cytotoxic CD4+ T cells (CD3+CD8-TIA1+) in light grey and helper CD4+ T cells (CD3+CD8-TIA1−) in dark grey. (B) Exhaustion panel illustrating exhausted/antigen-specific CD8+ T cells (CD8+PD1+) in white and PD-1 negative CD8+ T cells (CD8+PD1−) in light grey. (C) B cell panel illustrating B cells (CD79a+CD20+) in white and plasma cells (CD79a+CD20−) in light grey. (D) Macrophage panel illustrating immunosuppressive subset (CD163+PDL1+) in white and PDL1 negative subset (CD163+PDL1−) in light grey. (E,F) Example of PD1 and LAG3 expression on CD8+ T cells in primary (E) and recurrent (F) tumor tissue in patient GY.03. CD8 in yellow PD1 in red and LAG3 in blue.

