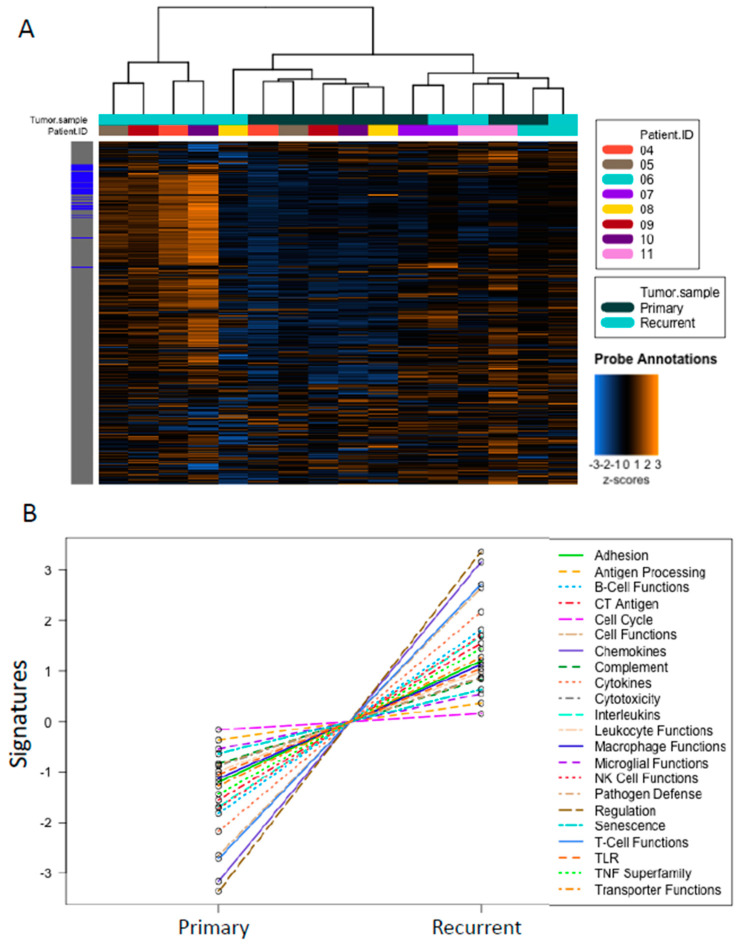
Figure 3.
NanoString analysis of primary vs. recurrent tumor samples. (A) Heatmap showing all genes analyzed with NanoString technology. Samples are clustered together based on expression patterns. Gene expression levels are illustrated with a Z score. Orange indicates high expression; blue indicates low expression. (B) Illustrating the change in the pathway signatures from primary to recurrent tumors using nSolver software.

