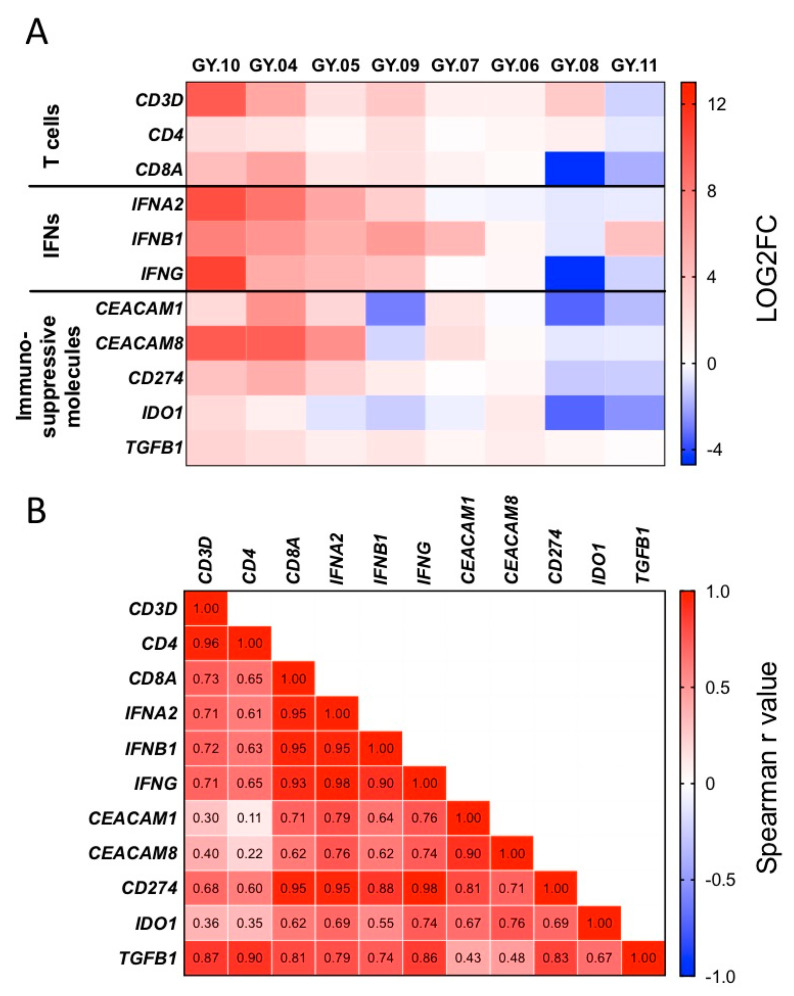
Figure 4.
NanoString analysis of primary vs. recurrent tumor samples. (A) Heatmap showing the log2 fold change values of the expression of selected genes from the primary and recurrent tumor samples analyzed with NanoString technology. Red indicates high expression and blue indicates low expression. (B) Spearman correlation matrix with r values. Red indicates a strong positive correlation, blue indicates a strong negative correlation and white indicates no correlation.

