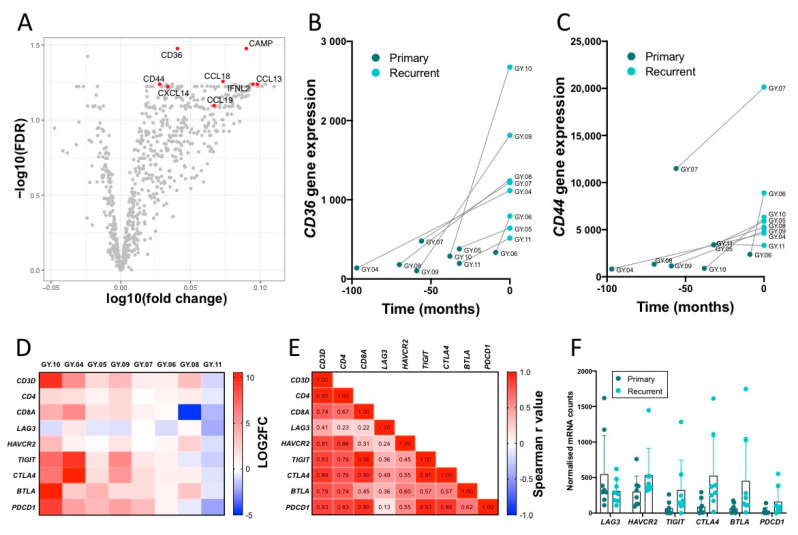
Figure 5.
NanoString analysis of top upregulated genes in recurrent tumor compared to primary tumor samples. (A) Volcano plot showing Log2 fold change and the false discovery rate (FDR) using the primary tumor samples as the baseline. Illustration of expression of CD36 (B) and CD44 (C) over time (months from primary to recurrence). Statistical analysis was performed with a Wilcoxon test. (D–F) shows the expression of T cell marker genes and immune checkpoint genes. (D) Heatmap showing the log2 fold change values of the expression of selected genes from the primary and recurrent tumor samples. Red indicates high expression and blue indicates low expression. (E) Spearman correlation matrix with r values. Red indicates a strong positive correlation, blue indicates a strong negative correlation and white indicates no correlation. (F) Gene expression levels of immune checkpoints in primary and recurrent tumors. Statistical significance between expression levels in primary and recurrent samples was tested using multiple Wilcoxon tests. No significant changes were found with adjusted p values, false discovery rate (FDR), LAG3: p = 0.252, HAVCR2: p = 0.252, TIGIT: p = 0.224, CTLA4: p = 0.118, BTLA: p = 0.118, PDCD1: p = 0.224.

