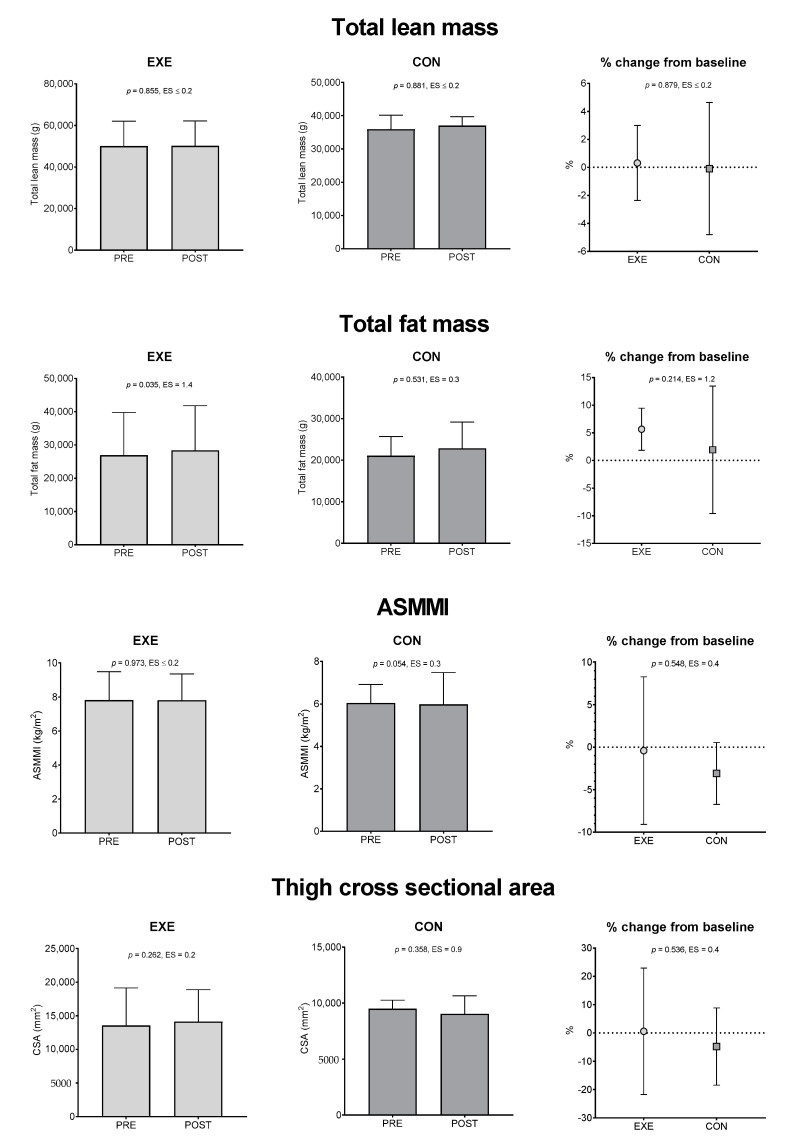
Figure 2.
Total lean mass, total fat mass, appendicular skeletal muscle mass index and cross-sectional area results. Values are expressed as mean ± 95% CI. Data were assessed by paired t-test (differences between PRE and POST within groups) and unpaired t-test (differences between groups). Level of significance was set at 0.05. The magnitude of changes was analyzed by Effect Size. EXE: experimental group; CON: control group; ASMMI: appendicular skeletal muscle mass index; p: p-value; ES: effect size.

