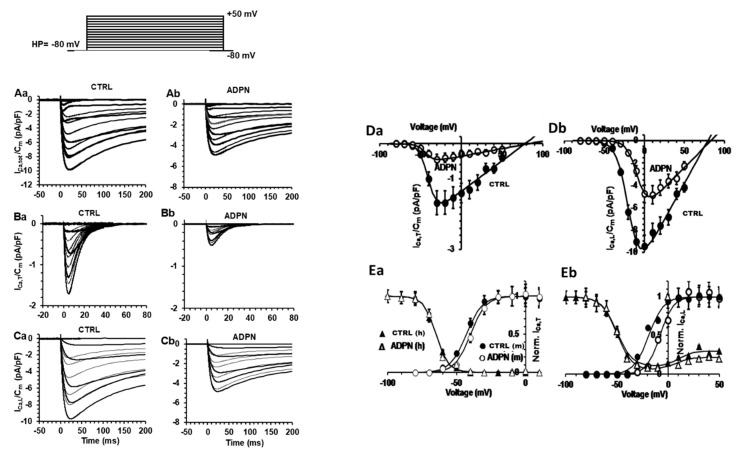
Figure 4.
Effects of ADPN on the voltage-dependence of T- and L-type Ca2+ channels activation. (Aa,Ab) Current traces of total inward Ca2+ currents (ICa) recorded in control SMC (Aa) and in the presence of ADPN (Ab). Current values are normalized to cell capacitance. (Ba,Bb) Representative time course of T-type Ca2+ currents (ICa,T) recorded in the presence of nifedipine from a control cell (Ba) and after ADPN addition (Bb). (Ca,Cb) Time course showing L-type Ca2+ currents (ICa,L) recorded in the high TEA-Ca2+ solution from a control cell (Ca) and after ADPN addition (Cb). Only the first 200 ms of the pulse are depicted. (Da,Db) I-V plots related to ICa,T (Da) and ICa,L (Db) in control (CTRL, filled circles) and ADPN-treated (ADPN, open circles) SMCs from the gastric fundus. Data are normalized for the mean cell capacitance. The lines through the experimental data are the fit with a Boltzmann function. (Ea,Eb) Steady-state activation and inactivation analysis for ICa,T (Ea) and ICa,L (Eb). Effect of ADPN on ICaT and ICa,L activation (open circles, m) with respect to control (filled circles, m); lack of effects on inactivation (CTRL, filled triangles, h; ADPN, open triangles, h). Note the U-shaped inactivation curve at positive potentials for ICa,L that is depressed in ADPN-treated cells. Current values are normalized to cell capacitance. All data are mean values ±SEM Statistical significance is not depicted in the figure for clarity but is reported for the various Boltzmann parameters in Table 2. Data are from CTRL n = 20 cells, ADPN n = 7 cells, (5 mice).

