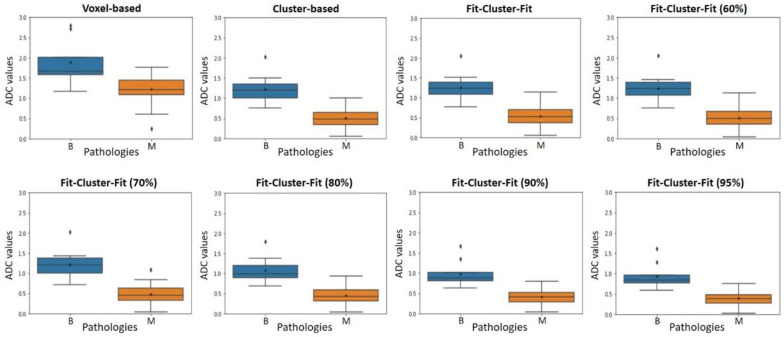
Figure 5.
Box-and-whisker plot representations of the apparent diffusion coefficient (ADC, 10−3 mm2/s) for benign (B) and malignant (M) neuroblastic tumors in voxel-based, cluster-based and Fit-Cluster-Fit models, applying different confidence thresholds to exclude uncertainties (60%, 70%, 80%, 90% and 95%). Outliers are plotted as individual points.

