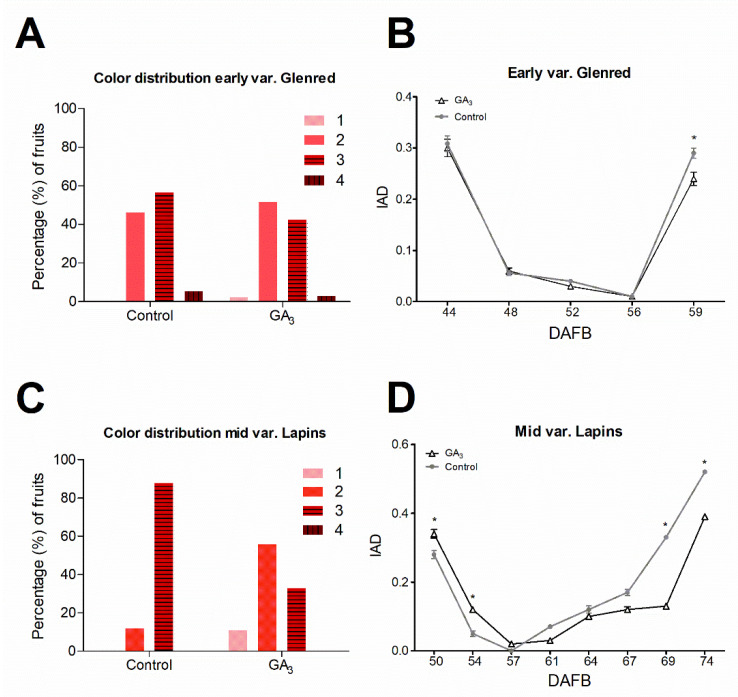
Figure 3.
Effect of GA3 on color distribution and index of absorbance difference (IAD) at harvest of early-season variety, Glenred (A,B) and mid-season variety, Lapins (C,D). 20 fruits from control and GA3 trees of Lapins and Glenred were randomly selected for nondestructive IAD measurements in the field and 25 fruits for color distribution assessment at harvest. Data as ± SEM ANOVA with Tukey’s post hoc test at p < 0.05 was conducted; “*” denotes statistical differences between GA3-treated and control fruits CTIFL (Centre Technique Interprofessionnel des Fruits et Légumes) color chart was used in (B,D), where 1 is the lightest color, and 4 is the darkest color, respectively (Figure S3). DAFB, days after full bloom.

