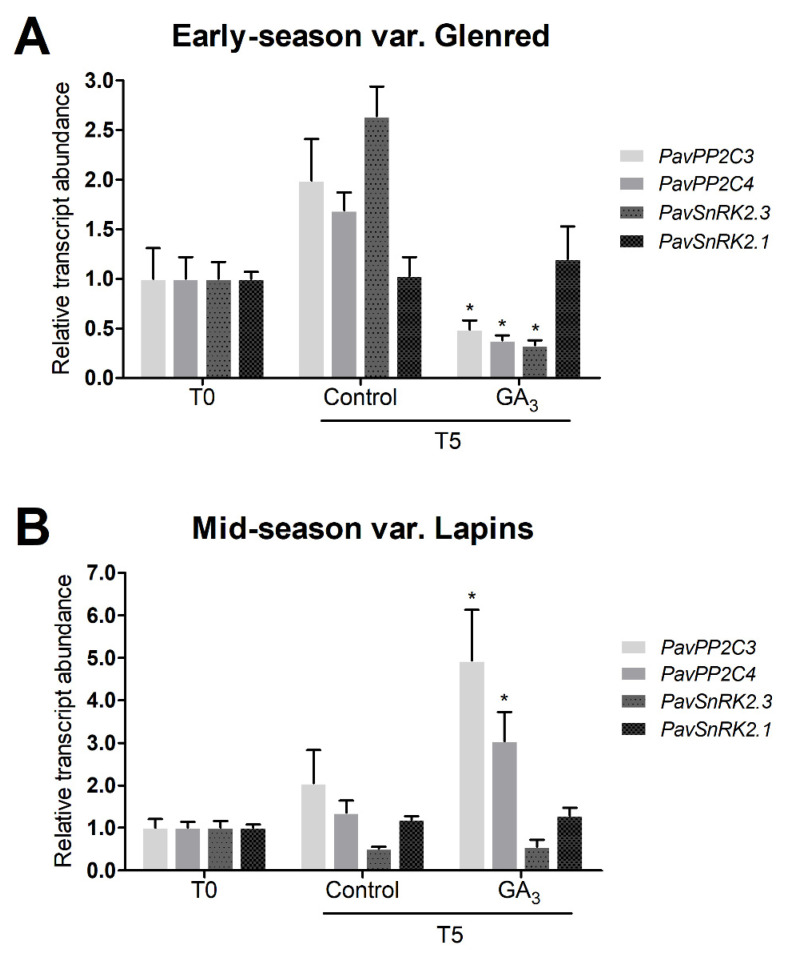
Figure 5.
Effect of GA3 on transcript abundance relative to PavCAC of PavPP2C and PavSnRK2 sweet cherry orthologs, 5 days after the treatment (T5). Fruits from control and GA3 trees of (A) early-season variety Glenred and (B) mid-season variety Lapins were randomly selected and pooled for the RT–qPCR analyses. Data as +SEM. Relative transcript abundance was set to 1.0 at T0, where T0 is the sampling performed immediately before GA3 application ANOVA with Tukey’s post hoc test at p < 0.05 was conducted; “*” denotes statistical differences between GA3-treated and control fruits for a gene.

