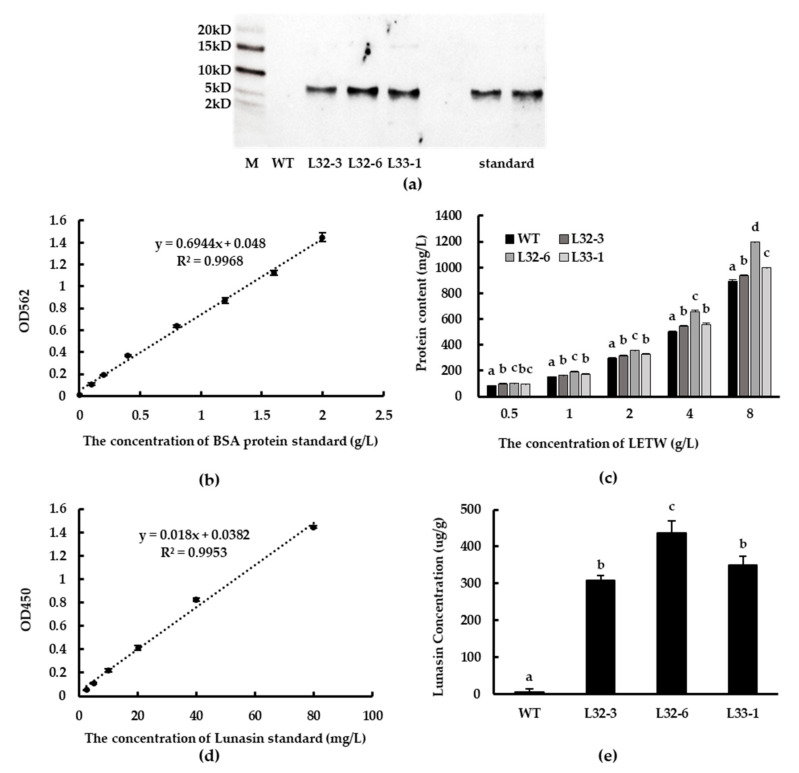
Figure 3.
Western blot analysis and detection of lunasin content. (a) Lunasin of transgenic wheat detected by western blot. (b) BSA standard curve for the BCA protein assay. (c) The protein content of lunasin-enriched fraction of transgenic wheat (LETW) and peptides-enriched fraction of wild-type wheat (PEWW) at different concentrations. (d) Lunasin standard curve detected by ELISA. (e) Lunasin content in wild-type wheat and different transgenic lines. Data are shown as the means of three independent experiments; different letters above the columns between different lunasin-overexpression lines show significant differences (p < 0.05).

