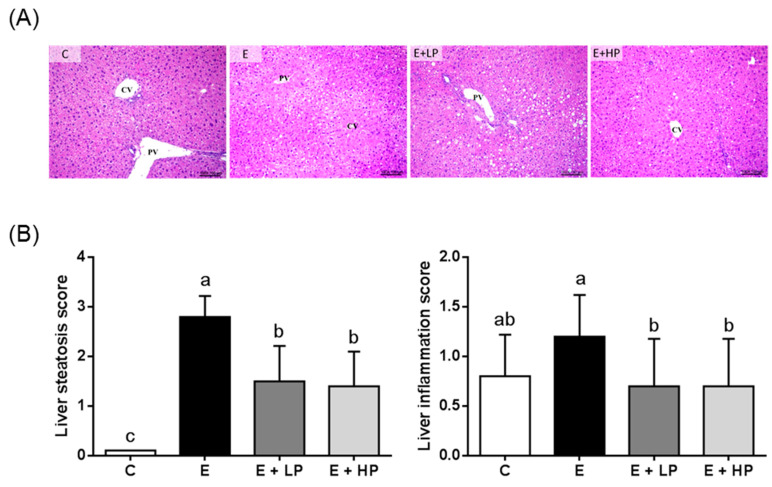
Figure 1.
Histopathological changes in the liver of mice at the end of the study. (A) Photomicrographs of hematoxylin and eosin (H&E)-stained mouse liver sections (original magnification, 100×). (B) Pathological scores. Values are expressed as the mean ± SD (n = 10). Significant differences (p < 0.05) are identified by different letters (a,b). C, control group; E, ethanol group; E + LP, low-dose PPE group; E + HP, high-dose PPE group; CV, central vein; PV, portal vein.

