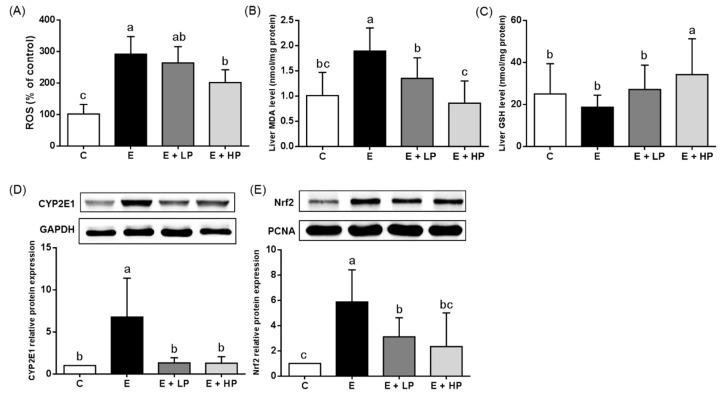
Figure 3.
Hepatic (A) relative ROS level, (B) MDA and (C) GSH concentrations, and (D) CYP2E1 and (E) nuclear Nrf2 protein expression of mice at the end of the study. Values are expressed as the mean ± SD (n = 10). Significant differences (p < 0.05) are identified by different letters (a–c). C, control group; E, ethanol group; E + LP, low-dose PPE group; E + HP, high-dose PPE group; MDA, malondialdehyde; GSH, glutathione; CYP2E1, cytochrome P450 2E1; Nrf2, nuclear factor erythroid 2-related factor 2.

