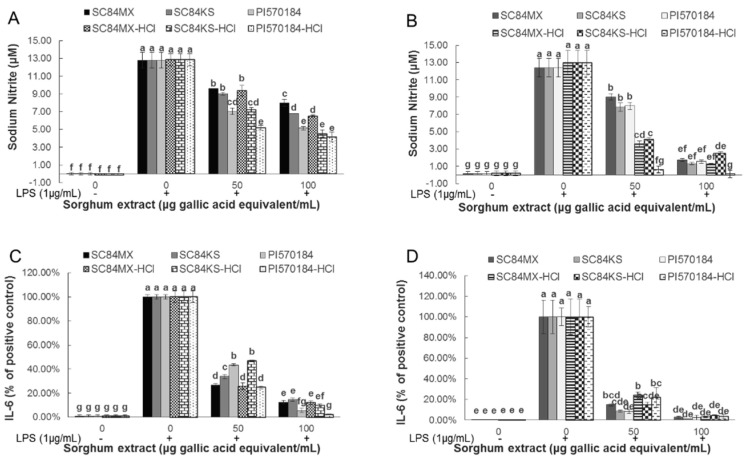
Figure 3.
Effects of sorghum phenolic extracts on NO and interleukin (IL)-6 production in LPS-induced RAW 264.7 macrophages. NO production by macrophages as affected by LPS and sorghum (A) water extracts and (B) ethanol extracts; IL-6 production as affected by LPS and sorghum (C) water and (D) ethanol extracts. Percentage production of IL-6 was calculated with respect to the positive control. Error bars are standard deviations (n ≥ 3). Different letters above columns indicate significant differences (p < 0.05).

