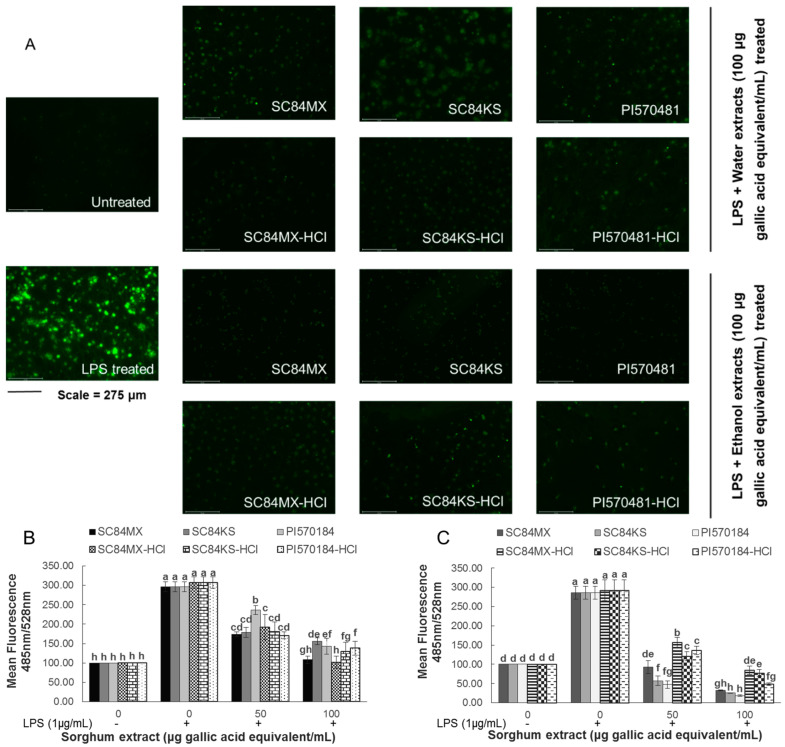
Figure 4.
(A) Fluorescence microscopy analysis of reactive oxygen species (ROS) production in LPS-induced macrophages as affected by treatment with sorghum water and ethanol extracts (100 μg gallic acid equivalent/mL), pictures were taken at 10× magnification with a scale bar of 275 μm. Mean fluorescence values of ROS that were affected by sorghum (B) water and (C) ethanol extracts in LPS-induced macrophages were quantified by fluorescence spectrophotometry and were expressed with respect to the negative control. Error bars are standard deviations (n ≥ 3). Different letters above columns indicate significant differences (p < 0.05).

