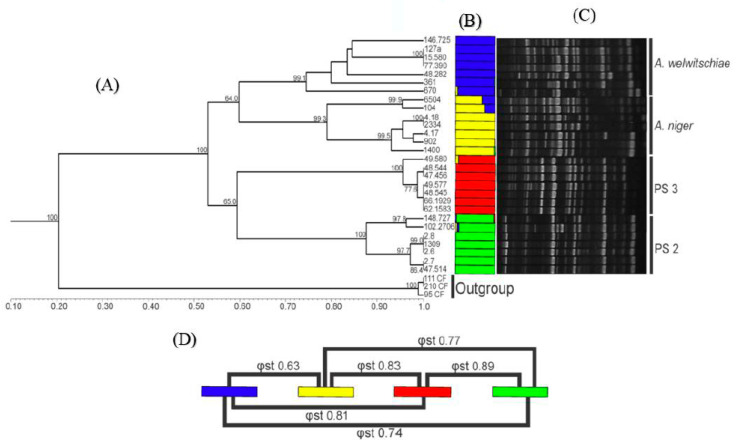
Figure 3.
Cluster analysis based on Random Amplified Polymorphic DNA (RAPD) markers. PS2 = Phylogenetic species 2, PS3 = Aspergillus vinaceus sp. nov. Each colour corresponds to a genetic group (K = 4). (A) Unweighted Pair Group Method with Arithmetic Mean (UPGMA) dendrogram obtained using the Dice similarity coefficient using A. carbonarius strains as the outgroup. (B) Bayesian analysis (Structure bar plot). (C) RAPD profile representative, OPAM 07 primer. (D) Pairwise φst index.

