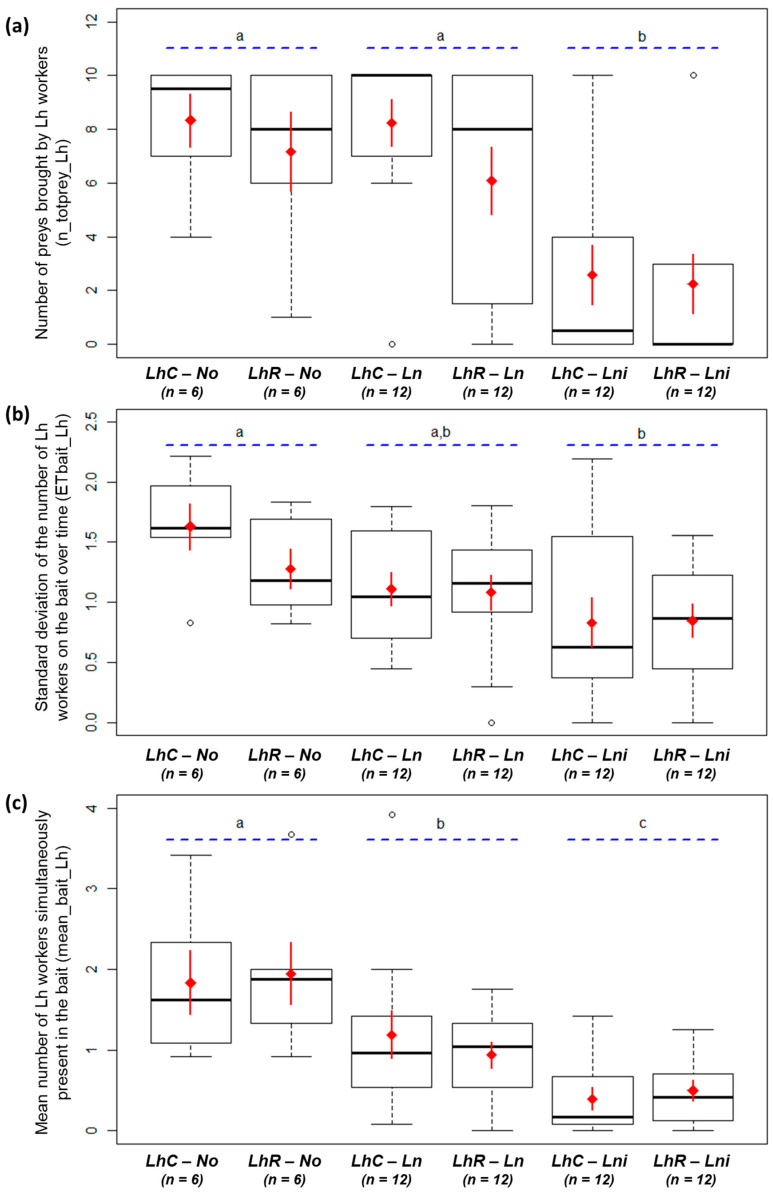
Figure 2.
(a) Number of preys brought by Linepithema humile during the interaction (n_totprey_Lh; n = 60). (b) Standard deviation of the numbers of L. humile on the bait over time (ETbait _Lh; n = 60). (c) Average number of L. humile on the bait during the interaction (mean_bait_Lh; n = 60). LhC: L. humile colonizer. LhR: L. humile resident. No: no opponent; Ln: Lasius neglectus opponent, Lni: Lasius niger opponent. White dots are outlier individuals; thick black horizontal line: median value; box ends: upper and lower quartiles; whiskers: max and min values. Red diamond: mean value; red solid line: standard error of the mean (SEM). Letters a, b, and c (blue dotted lines) indicate significant differences between opponent species.

