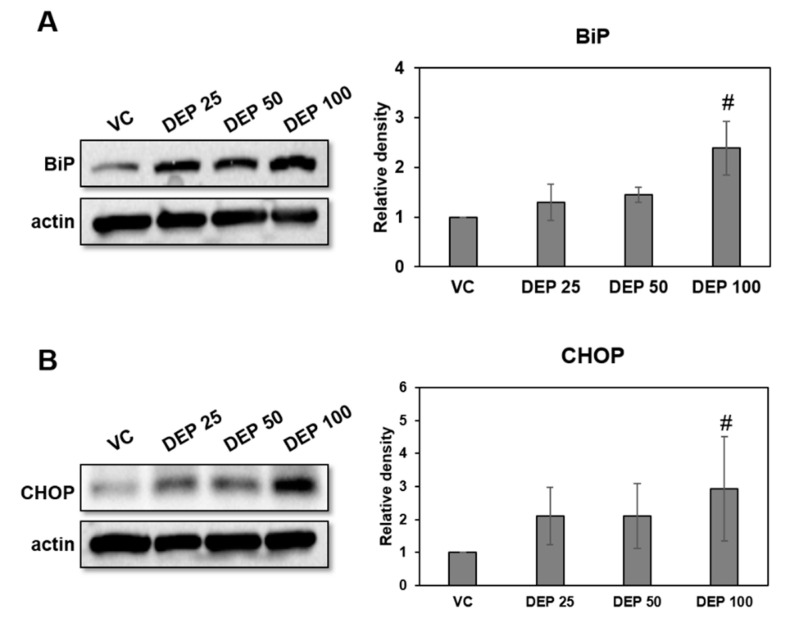
Figure 3.
Expression levels of the ER stress markers BiP and CHOP in DEP-induced mice. Representative Western blots and relative densities of (A) BiP and (B) CHOP in lung tissues of DEP-induced mice. Mice were treated three times by DEP and sacrificed at day 9. Data are means ± SD (n = 5 per group). # p < 0.05 vs vehicle control.

