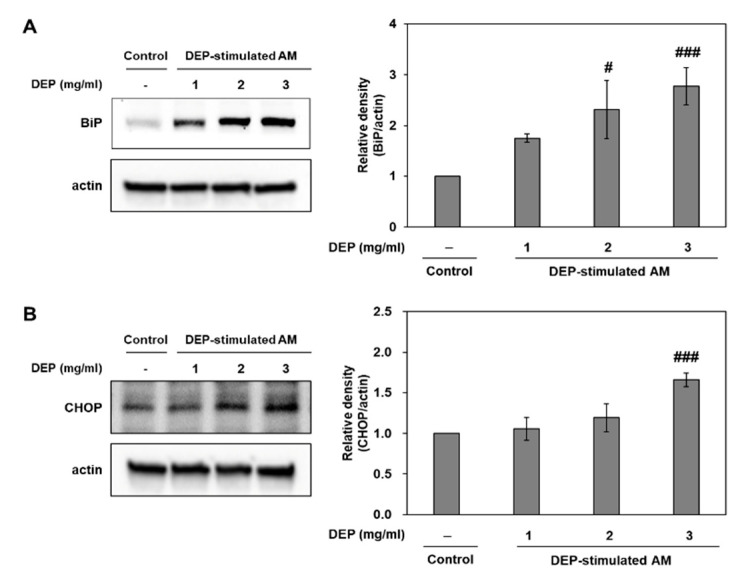
Figure 5.
Expression levels of the ER stress markers BiP and CHOP in DEP-stimulated AM. Representative Western blots and relative densities of (A) BiP and (B) CHOP in DEP-stimulated AM. AM were stimulated with DEP 1, 2, or 3 mg mL−1. Western blotting was performed 3 h after DEP stimulation. Data are means ± SD (n = 3 per group). # p < 0.05 or ### p < 0.001 vs. control.

