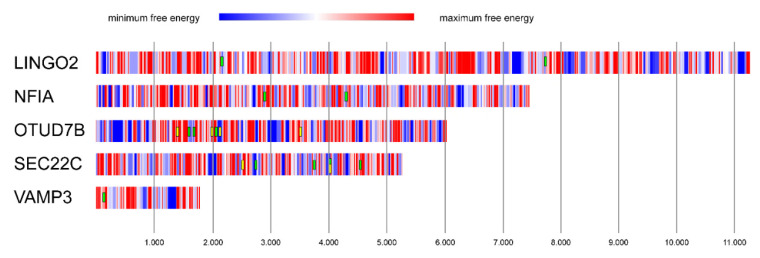
Figure 10.
Prediction of RNA–RNA interaction between LINC00518 and mRNAs. Graphical representation of free energy (kJ) computed from the binding of LINC00518 and the 3′-UTRs of the regulated mRNAs. A color-coded scale, based on free energy values, is used to depict the 3′-UTRs of mRNAs: blue regions represent the binding tracts with minimum free energy, and, accordingly, they represent the most reliable binding regions. The boxes represent miRNAs binding to minimum free energy regions: LINGO2: miR-497-5p; NFIA: miR-143-3p; OTUD7B: miR-145-5p (green) and miR-497-5p (yellow); SEC22C: miR-199a-5p (green) and miR-212-5p (yellow); VAMP3: miR-3191-3p. Free energy scale limits: (1) LINGO2: minimum = −28.57, maximum = 2.32; (2) NFIA: minimum = −20.18, maximum = 2.14; (3) OTUD7B: minimum = −33.26, maximum = 8.07; (4) SEC22C: minimum = −27.55, maximum = 1.09; and (5) VAMP3: minimum = −23.87, maximum = −0.59. Nucleotide position of the 3′UTR of each mRNA is shown.

