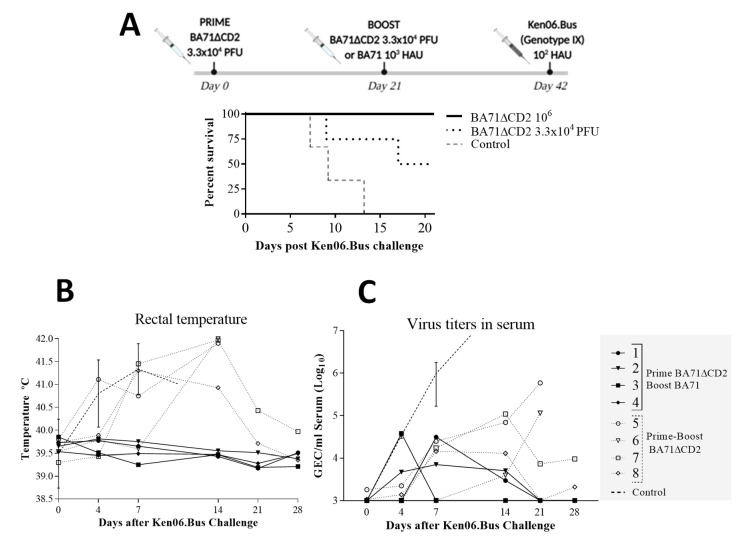
Figure 2.
(A) Schematic representation the in vivo experimental design with survival rates observed after Ken06.Bus challenge and comparison of the kinetics of (B) fever and (C) ASFV load in serum, after Ken06.Bus challenge. Data plotted in panels B and C correspond to individual animals inoculated with BA71∆CD2 and boosted with either BA71 (black lines) or BA71∆CD2 (dotted lines). Average and standard deviation values obtained from control animals are also depicted (dashed line). Virus titers are plotted on a logarithmic scale as genome equivalent copies (GEC) per milliliter of serum, being 1 GEC/µL serum the limit of detection of the assay.

