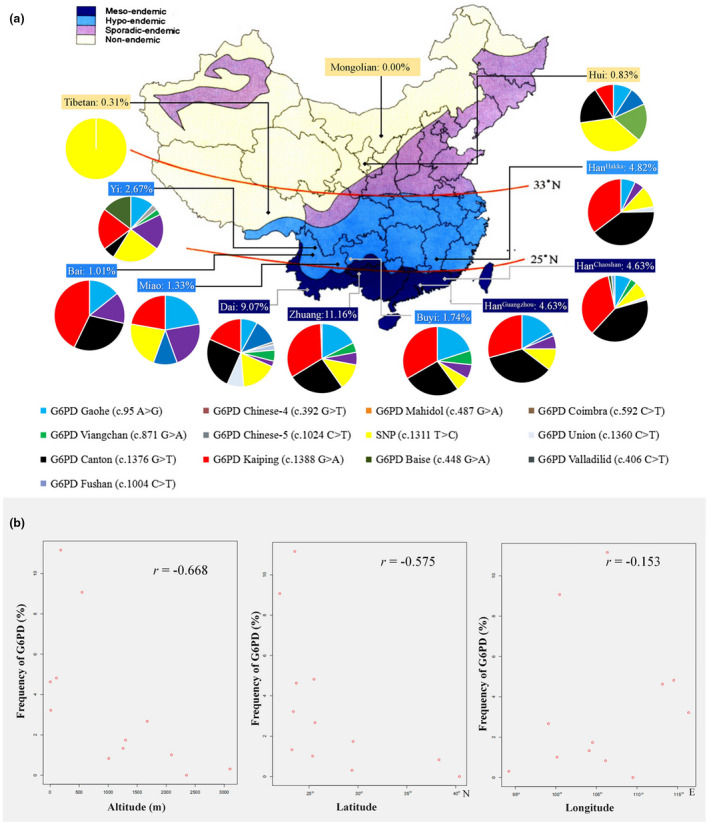
FIGURE 1.

Epidemiology of G6PD deficiency, spatial distribution of historical malaria, and relationship with geographical coordinates in China. (a) The frequency and mutation spectrum of G6PD deficiency in 12 Chinese populations in the current study and the relationship with the spatial distribution of historical malaria endemicity in China. Different colors on the map of China represent the different epidemic degrees of malaria. Different colors on each pie represent the different SNPs of G6PD; (b) shows the relationship between the occurrence frequency of G6PD deficiency and latitude, longitude, and altitude
