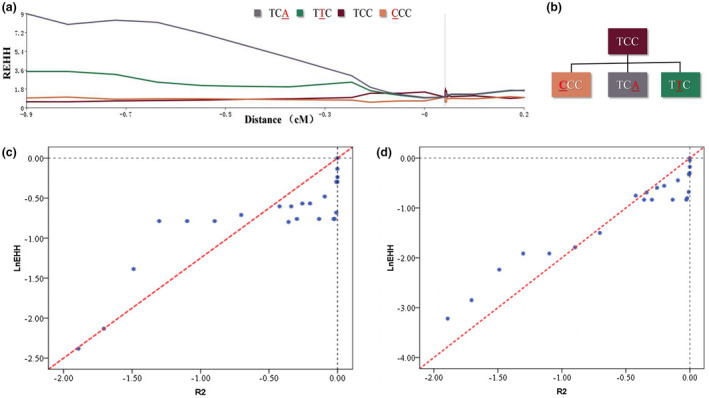
FIGURE 3.

Results of evolutionary analysis. (a) REHH plot of the core region covering the G6PD Canton (rs72554664) and G6PD Kaiping (rs72554665) in the Zhuang population. The values are plotted against the genetic distance from the selected core region. The plot of core haplotype containing G6PD Canton or G6PD Kaiping is indicated by the solid purple line and solid green line, respectively. (b) Phylogenetic network of haplotypes of one Tag SNP (rs1050757), G6PD Canton and Kaiping. (c) Evaluation of the ages of the G6PD Canton by linear regression of ‐ln(EHH) and 2r. The X‐axis represents the 2 × r, where r is the genetic distance between the core and a given marker; the Y‐axis represents the –lnEHH of that marker. We could obtain the vector of (r, EHH) for each marker and make a plot. Each diamond corresponds to an SNP. (d) Evaluation of the ages of the G6PD Kaiping by linear regression of ‐ln(EHH) and 2r. The X‐axis represents the 2 × r, where r is the genetic distance between the core and a given marker; the Y‐axis represents the –lnEHH of that marker. We could obtain the vector of (r, EHH) for each marker and make a plot. Each diamond corresponds to an SNP
