FIGURE 4.

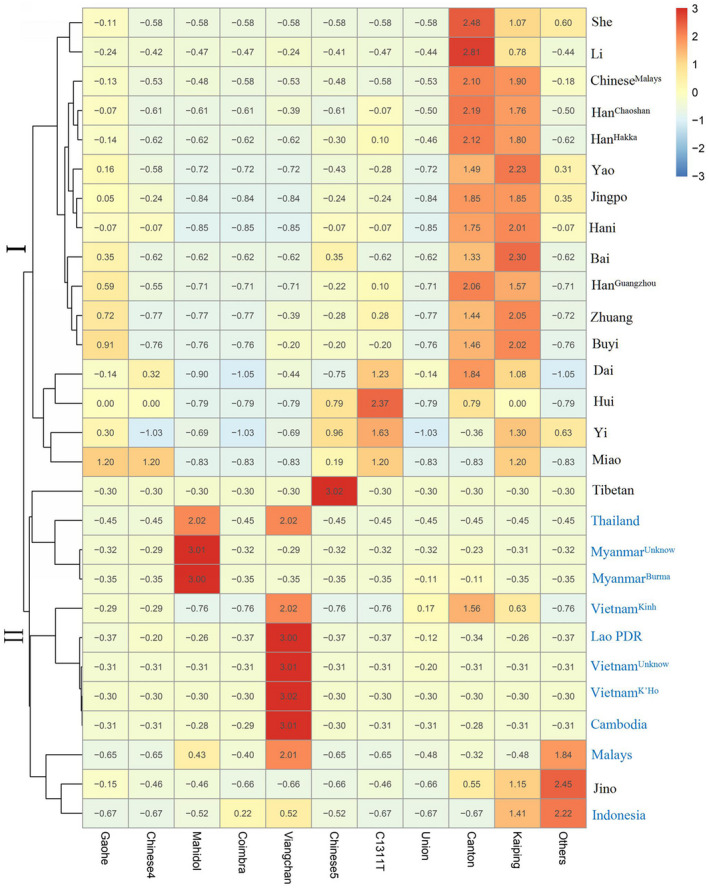
Heatmap of G6PD‐deficient allele frequency distributions for Chinese and Southeast Asian populations. Blue indicates the lowest allele frequency, and red indicates the highest G6PD‐deficient allele frequency

Heatmap of G6PD‐deficient allele frequency distributions for Chinese and Southeast Asian populations. Blue indicates the lowest allele frequency, and red indicates the highest G6PD‐deficient allele frequency