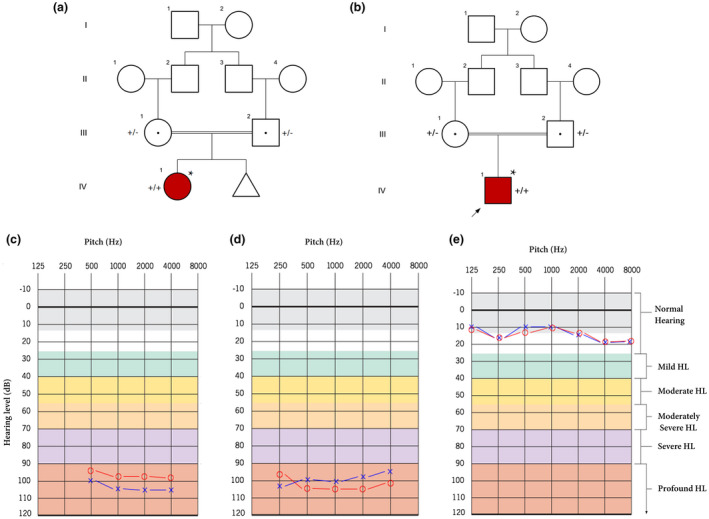
FIGURE 1.

(a) pedigree information showing variation spectrum ofTMC1in the family 1. (+): c.530T>C; (−): wild‐type allele. (b) pedigree of family 2 indicates a patient with theCDH23variant. In this figure, (+): c.2334G>A. The asterisk (*) shows the samples that were selected for performing whole‐exome sequencing. In these figures, white symbols: unaffected; red symbols: affected; squares: men; circles: females; parallel lines: consanguineous marriage. (c) The audiogram showed bilateral profound sensorineural hearing loss of the female affected subject in family 1 (IV.1). (d) The audiogram revealed the profound sensorineural hearing loss of the male proband in family 2 (IV.1). (e) The audiogram of the control individual (III.1), who was selected from family 1. Approximately, the same results were obtained for other next of kin in both families. The graphs are depicted using audiogram‐creator (https://www.hearingaidknow.com) according to the original graphs provided by otorinologists. Blue crosses and red circles represent the air conduction hearing threshold levels of the left and right ear, respectively
