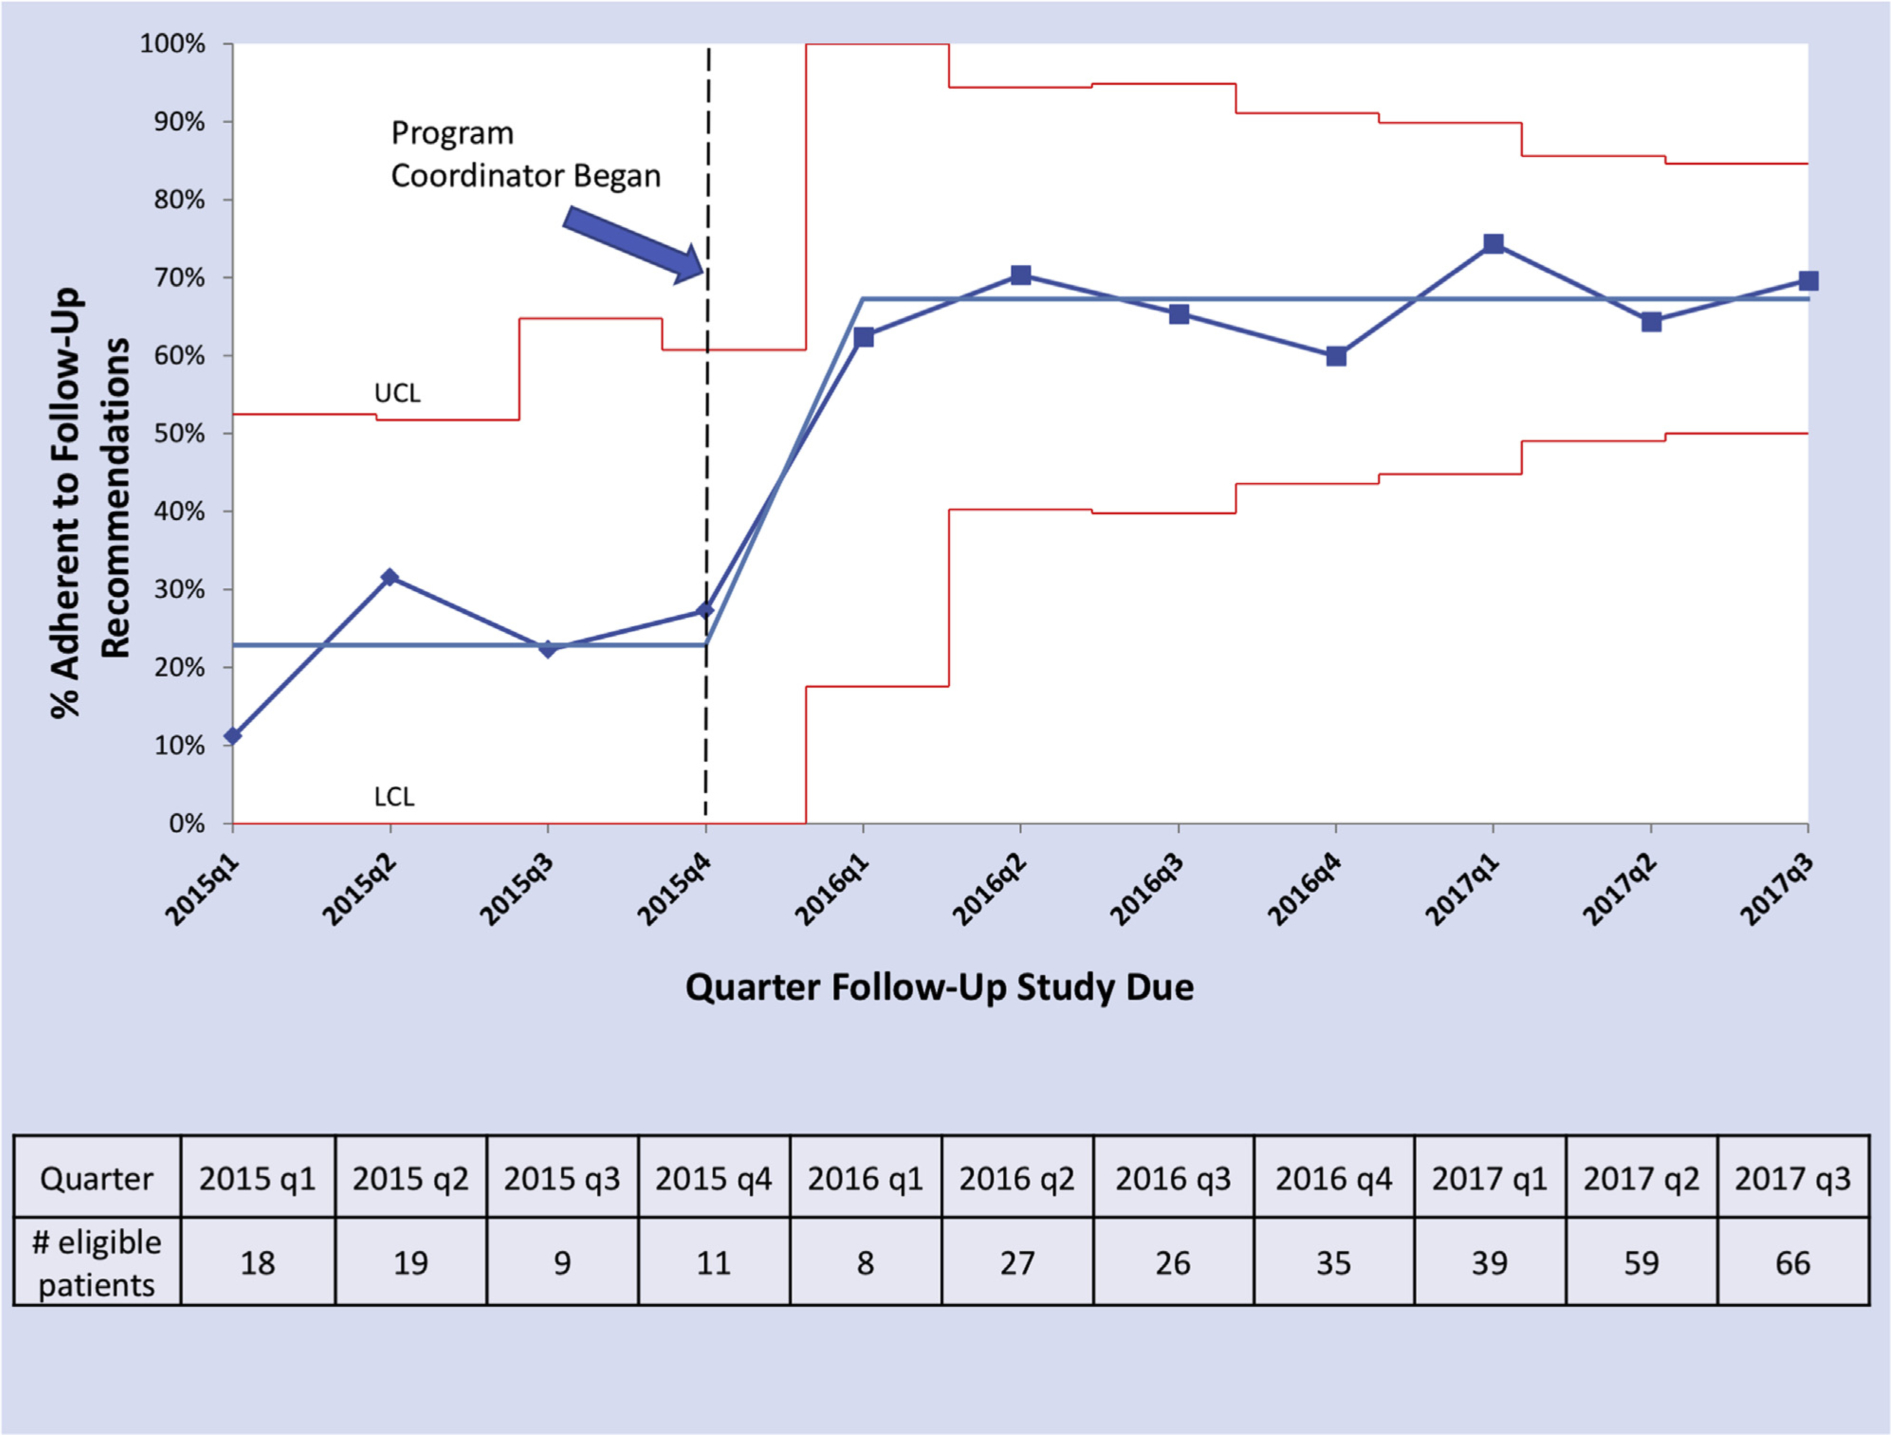
Fig 2.

Adherence to annual lung screening follow-up over time. P-chart demonstrating quarterly adherence among those eligible for follow-up screening over time. Dotted black vertical line represents when the program coordinator was hired. Grey horizontal lines represent mean adherence values (before and after hiring of the program coordinator). Red lines represent upper control limit (UCL) and lower control limit (LCL). Control limits vary by quarter and represent 3 SDs from the central line (based on standard statistical process control methodology). As the central line (mean adherence) is a proportion, the LCL must be greater than or equal to zero. Number of eligible patients in each quarter is presented below the p-chart.
