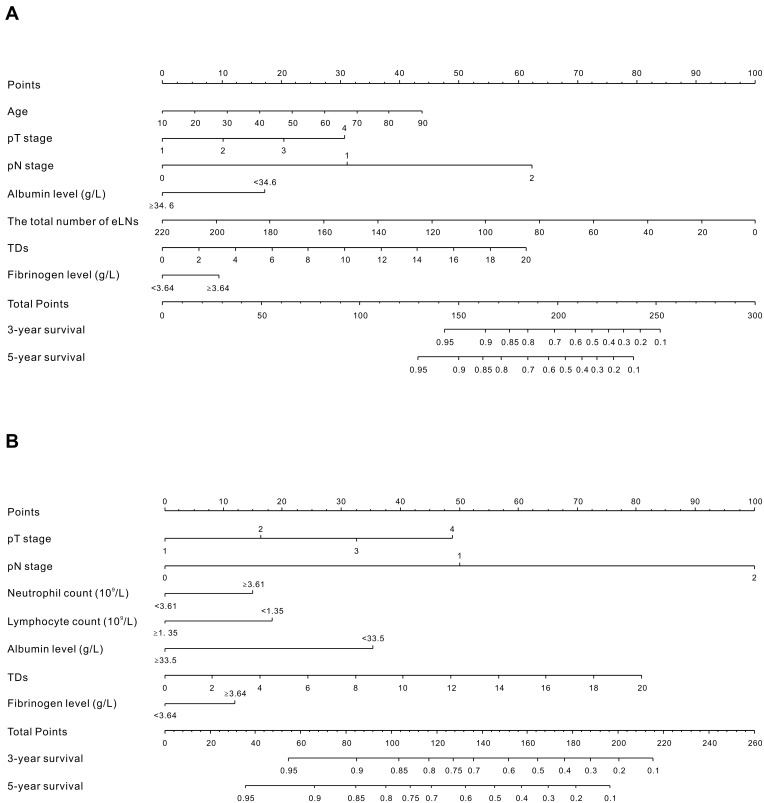
Figure 3.
Nomograms developed for predicted overall survival (A) and cancer-specific survival (B) in patients with nonmetastatic CRC. Locate the patient’s pT stage and draw a straight line toward the “Points” axis to determine the score associated with that pT stage. Repeat the process for each variable, sum the scores obtained for each covariate, and locate this sum on the “Total Points” axis. Draw a straight line straight downwards to determine the likelihood of 3- or 5-year OS and CSS.
Abbreviations: eLNs, examined lymph nodes; TDs, tumor deposits.

