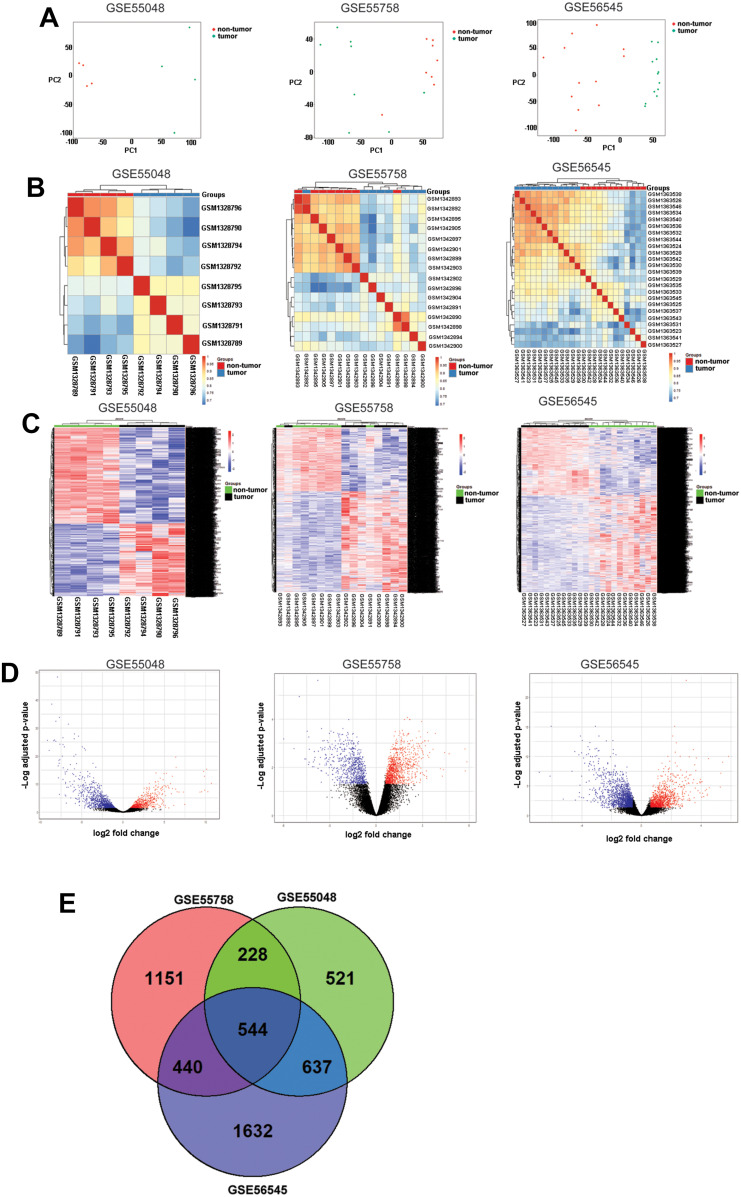
Figure 1.
Analysis of DEGs in GSE55048, GSE55758, and GSE56545 datasets. (A) PCA analysis of GSE55048, GSE55758, and GSE56545 expression datasets. (B) Correlation analysis of GSE55048, GSE55758, and GSE56545 expression datasets. (C) Heatmap clustering of the DEGs between non-tumor and tumor groups in GSE55048, GSE5575, and GSE56545 datasets. (D) Volcano plot of the DEGs between non-tumor and tumor groups in GSE55048, GSE5575, and GSE56545 datasets. (E) Common DEGs shared by the three datasets.

