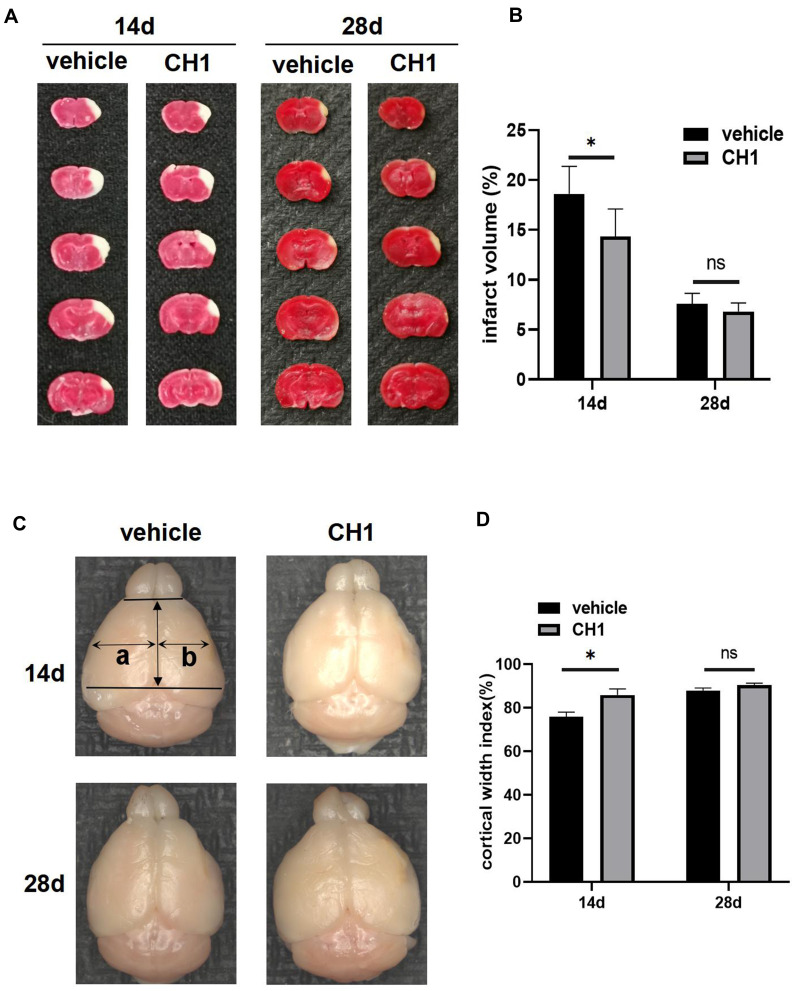
Figure 2.
Treatment with CH1 reduced infarct volume and increased cortical width index at 14d post-stroke but not at 28d. (A and B) Representative images (A) and statistical graph (B) of infarct volume stained with TTC 14d and 28d after dMCAO in vehicle and CH1 group. Absence of red stain represents infarct area. (C and D) Ex vivo images (C) and statistical graph (D) of cortical width index 14d and 28d after dMCAO, a and b mark the maximum width from the midline to the edge of the noninfarcted and infarcted hemispheres, respectively. *P< 0.05, ns: no significance by t-test, n = 6 mice per group.

