
Fig. 3.
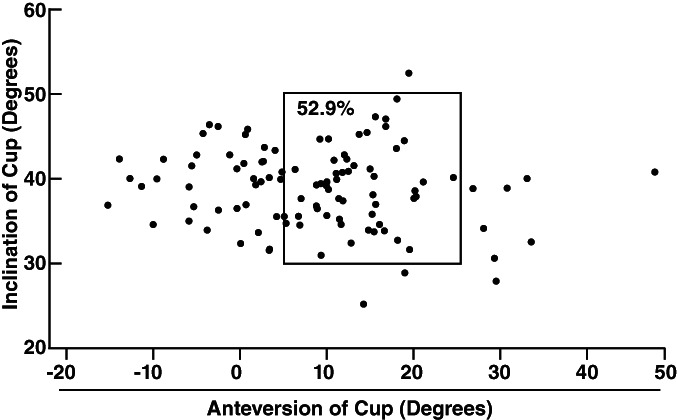
Scatter plots depicting the anteversion and inclination of the cup. The rectangle shows the hips that were within the Lewinnek safe zones.
Official websites use .gov
A
.gov website belongs to an official
government organization in the United States.
Secure .gov websites use HTTPS
A lock (
) or https:// means you've safely
connected to the .gov website. Share sensitive
information only on official, secure websites.
Scatter plots depicting the anteversion and inclination of the cup. The rectangle shows the hips that were within the Lewinnek safe zones.