Fig. 3.

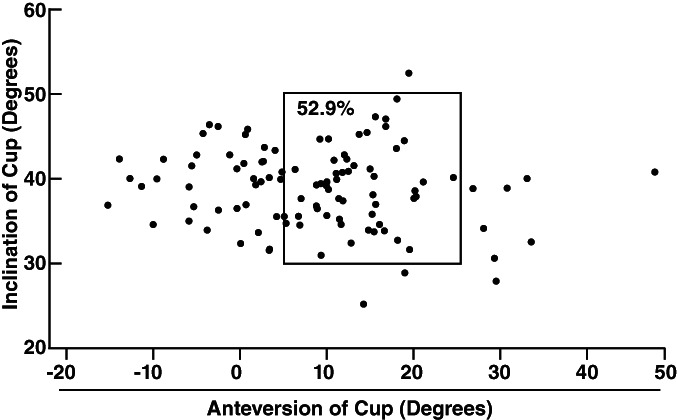
Scatter plots depicting the anteversion and inclination of the cup. The rectangle shows the hips that were within the Lewinnek safe zones.

Scatter plots depicting the anteversion and inclination of the cup. The rectangle shows the hips that were within the Lewinnek safe zones.