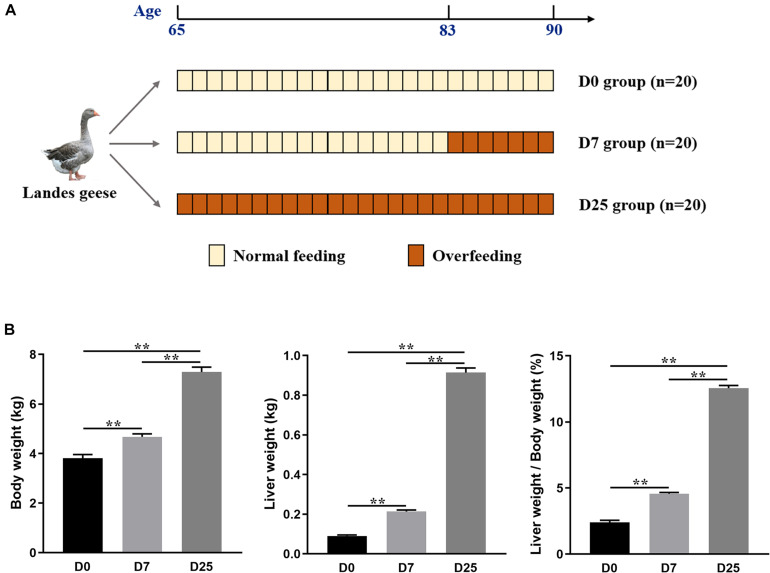
FIGURE 1.
Experimental design used in the study (A). The effects of overfeeding on the body weight, liver weight, and the ratio of liver weight to body weight of Landes geese (B). Values are means with their standard errors. Asterisks indicate statistically significant differences among the groups: **P < 0.01. n = 10 per group. D0, overfeeding for 0 day; D7, overfeeding for 7 days; D25, overfeeding for 25 days.

