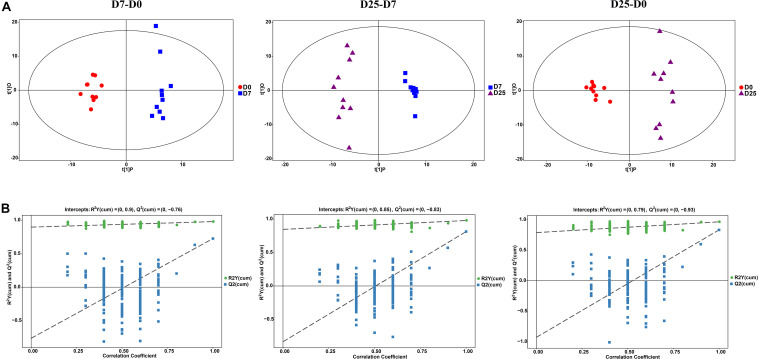
FIGURE 3.
The analysis of GC-TOF/MS of geese serum samples. (A) Shows the OPLS-DA score plots among the D0, D7, and D25 groups. (B) Shows the OPLS-DA corresponding validation plots among the D0, D7, and D25 groups. GC-TOF/MS, gas chromatography-time-of-flight mass spectrometry; OPLS-DA, orthogonal partial least squares discriminant analysis. D0, overfeeding for 0 day; D7, overfeeding for 7 days; D25, overfeeding for 25 days.

