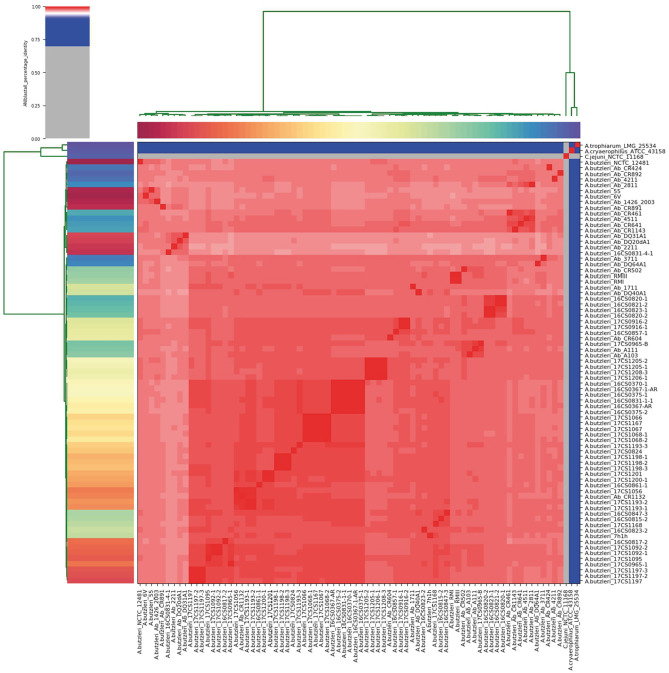
Figure 1.
Results of the ANI analysis. The cells in the heatmap corresponding to an ANI value of 95% and above are colored in red, indicating that the associated strains belong to the same species. Strains that do not belong to the same species are colored in blue. The dendrograms (above and on the left side), representing hierarchical clustering of the analysis results in two dimensions, were constructed by the simple linkage of the ANI percentage identities, and correspond to the results of the clustering of the ANI values between the used strains.

