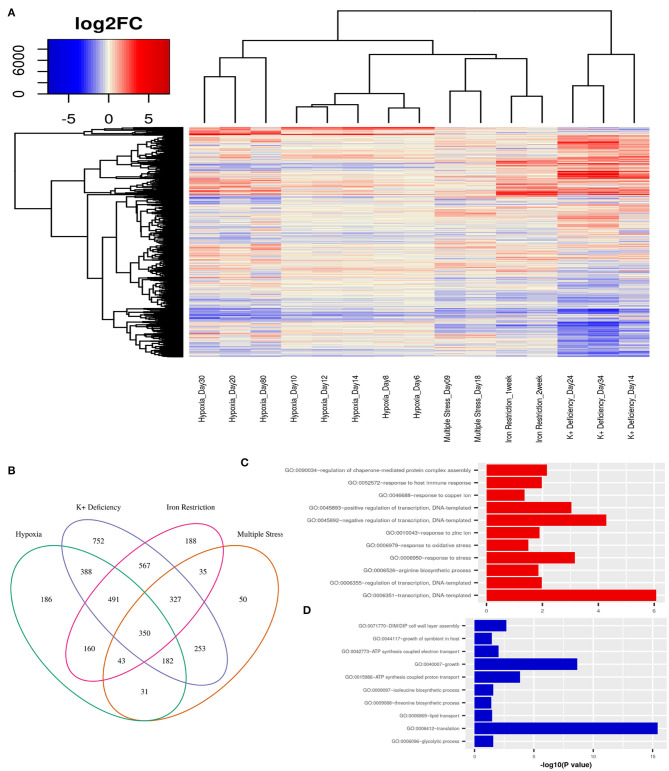
Figure 2.
(A) Variations in gene expression profiles of Mtb in different in-vitro dormancy models with respect to actively replicating Mtb. Gene expression alterations are depicted as log2(fold changes) over an exponential growth condition taken as the reference in each dataset. Red signifies upregulation and blue signifies downregulation of gene expression. Each column in the heatmap shows the gene expression in the time point and model indicated in the figure. (B) A Venn diagram showing the overlap between DEGs (fold change ≥ ±1.5, FDR ≤ 0.05) between different dormancy models w.r.t. exponential growth. 350 genes were differentially regulated in all four dormancy models at some time point and 1393 genes were differentially regulated in at least 3 models. (C) GO: biological processes overrepresented in the commonly upregulated genes amongst dormancy conditions and (D) GO: biological processes overrepresented amongst the genes commonly downreguated across multiple dormancy conditions as analyzed using the enrichment tool in DAVID database (Huang et al., 2009).

