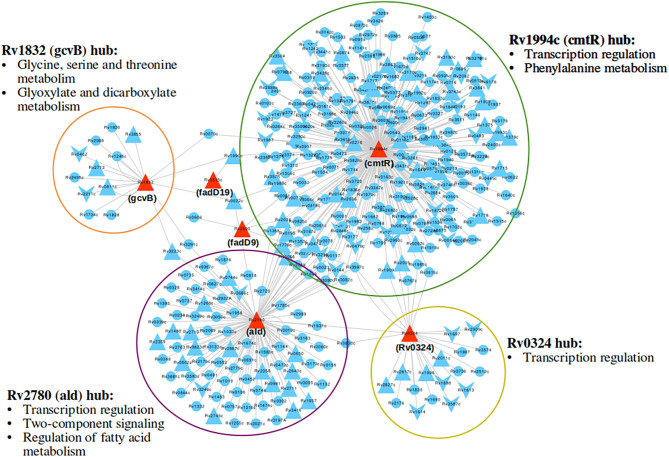
Figure 4.
A subnetwork of union dormancy response network for the 6 shortlisted drug target candidates and their first neighbors. The target candidates are colored in red. Upward and downward triangular nodes signify up and downregulation of gene expression, respectively. cmtR (Rv1994c) is the biggest hub in the network, followed by ald (Rv2780). Most over-represented pathways among the first neighbors of each of the hubs are mentioned.

