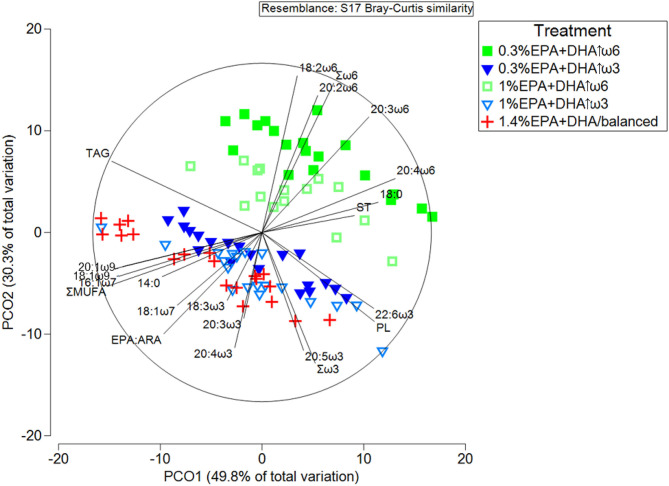
Figure 1.
Principal coordinates analysis (PCoA) of lipid and FA composition (%) (r2 > 0.45) in the head kidney of Atlantic salmon after 12 weeks of feeding diets with different ratios of ω6:ω3 and levels of EPA+DHA. PL, ST, and TAG represent the lipid classes phospholipid, sterol and triacylglycerol, respectively. ΣMUFA and EPA:ARA represent total monounsaturated fatty acids and the ratio of eicosapentaenoic (20:5ω3) to arachidonic (20:4ω6) acid, respectively.

