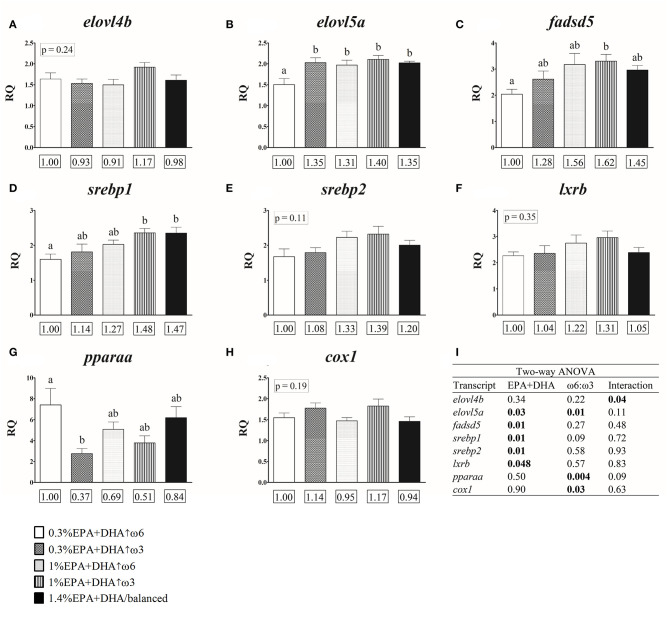
Figure 2.
Head kidney qPCR transcripts related to fatty acid metabolism (A–G) and eicosanoid synthesis (H) in salmon fed diets with different ratios of ω6:ω3 and levels of EPA+DHA for 12 weeks. Transcripts identified as statistically significant in the two-way ANOVA analysis are presented (A–I). Transcript expression data of these and other genes of interest (GOIs) are presented in Supplementary Table 5. Transcript expression values presented as mean relative quantity (RQ) ± SE (n = 7–8). Different letters above error bars indicate significant differences among treatments. When differences were not statistically significant (one-way ANOVA and Tukey post-hoc tests; p > 0.05), p-values are shown above error bars. Values below each GOI represent fold-changes relative to the 0.3% EPA+DHA↑ω6 treatment (see Materials and Methods). (I) Two-way ANOVA results. Significant differences (p < 0.05) are shown in bold font. Two-way ANOVA analysis of the entire set of GOIs is presented in Supplementary Table 6.

