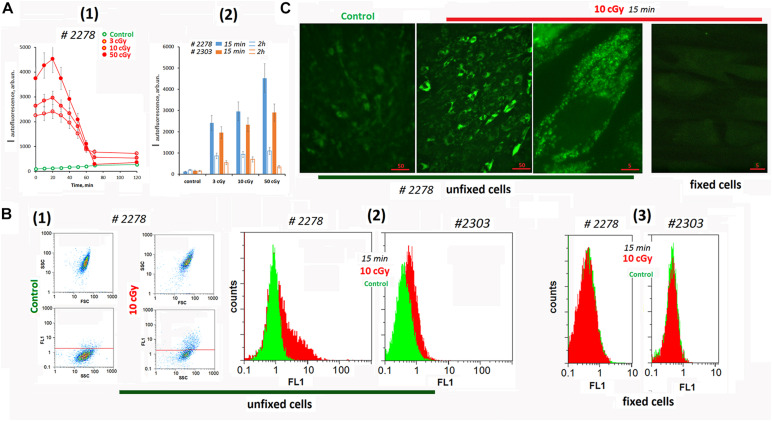
FIGURE 1.
Autofluorescence of the irradiated cells. (A) Plate assay (λex = 490 nm and λem = 524 nm). (1) Time dependence of the signal after irradiation with doses of 3, 10, and 50 cGy. (2) Comparison of two cell lines by signal intensity 15 min and 2 h after irradiation. Average values are given for two experiments. In each experiment; cells were analyzed in four wells of the plate. (B) FACS. (1) Plots: SSC versus FSC and FL1 versus SSC. (2) The distribution of the unfixed MSCs with varying autofluorescence. (3) The distribution of the fixed MSC (10 cGy) with varying autofluorescence. The experiment was repeated three times. (C) Fluorescence microscopy of irradiated unfixed and fixed with 3% paraformaldehyde MSCs. The experiment was repeated three times.

