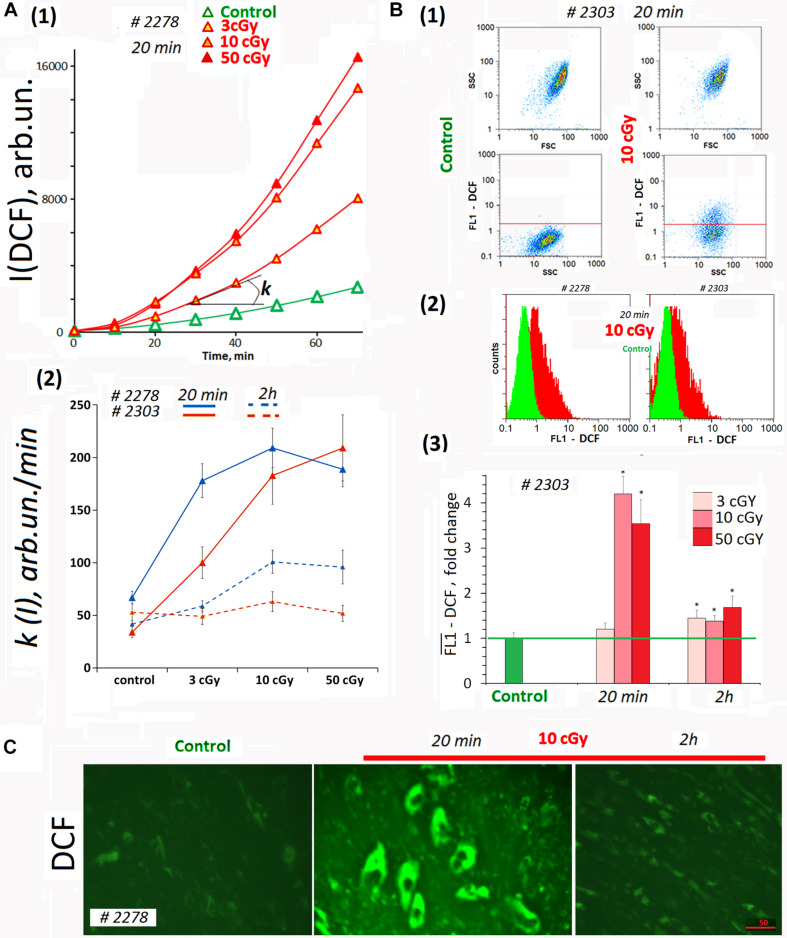
FIGURE 2.
ROS levels in the irradiated cells. (A) Plate assay (FL-reader). The cells were analyzed using total fluorescence assay in the 96-well plate format at λex = 490 nm and λem = 524 nm. (1) Example of reaction rate constant determination for DCF formation when DCFH reacts with ROS. Cells were irradiated with doses of 3, 10, and 50 cGy and were cultivated for 20 min. The cultivation environment was replaced by 5 μM H2DCFH-DA in PBS solution and a fluorescence intensity increase was detected. The slope of the line is the reaction rate constant for DCF formation [k(I)]. (2) The constants k(I) of the rate of DCF formation in MSCs #2278 and #2303. The H2DCFH-DA reagent was added 20 min or 2 h after irradiation. Average values and SD are given for three experiments. In each experiment, cells were analyzed in four wells of the plate. (B) FACS. (1) Plots: SSC versus FSC and FL1-DCF versus SSC. (2) The distribution of MSCs #2278 and #2303 (10 cGy, 20 min after LDIR) with varying DCF signal. (3) Median signals for FL1–DCF. Signals are normalized to control values. Average values and SD are given for three experiments. *p < 0.001 (U test). (C) Fluorescence microscopy. Before the treatment with LDIR, cells were grown for 48 h in slide flasks. Twenty minutes or 2 h after LDIR, the cultivation environment was replaced by 5 μM H2DCFH-DA in PBS solution, and a fluorescence intensity increase was detected. The experiment was repeated three times.

